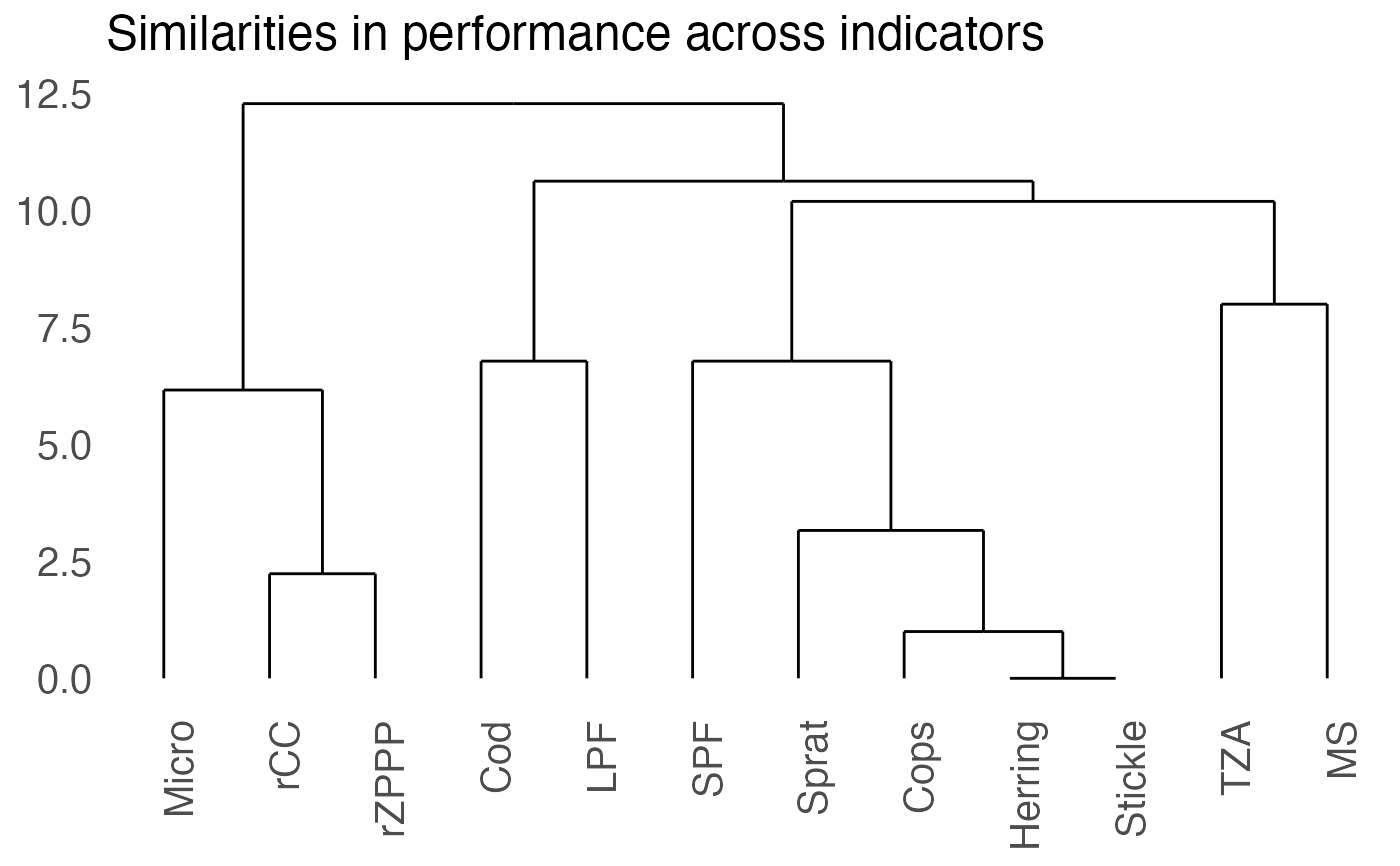
plot_clust_sc generates from the cluster analysis a dendrogram based on
the ggplot2 and ggdendro packages.
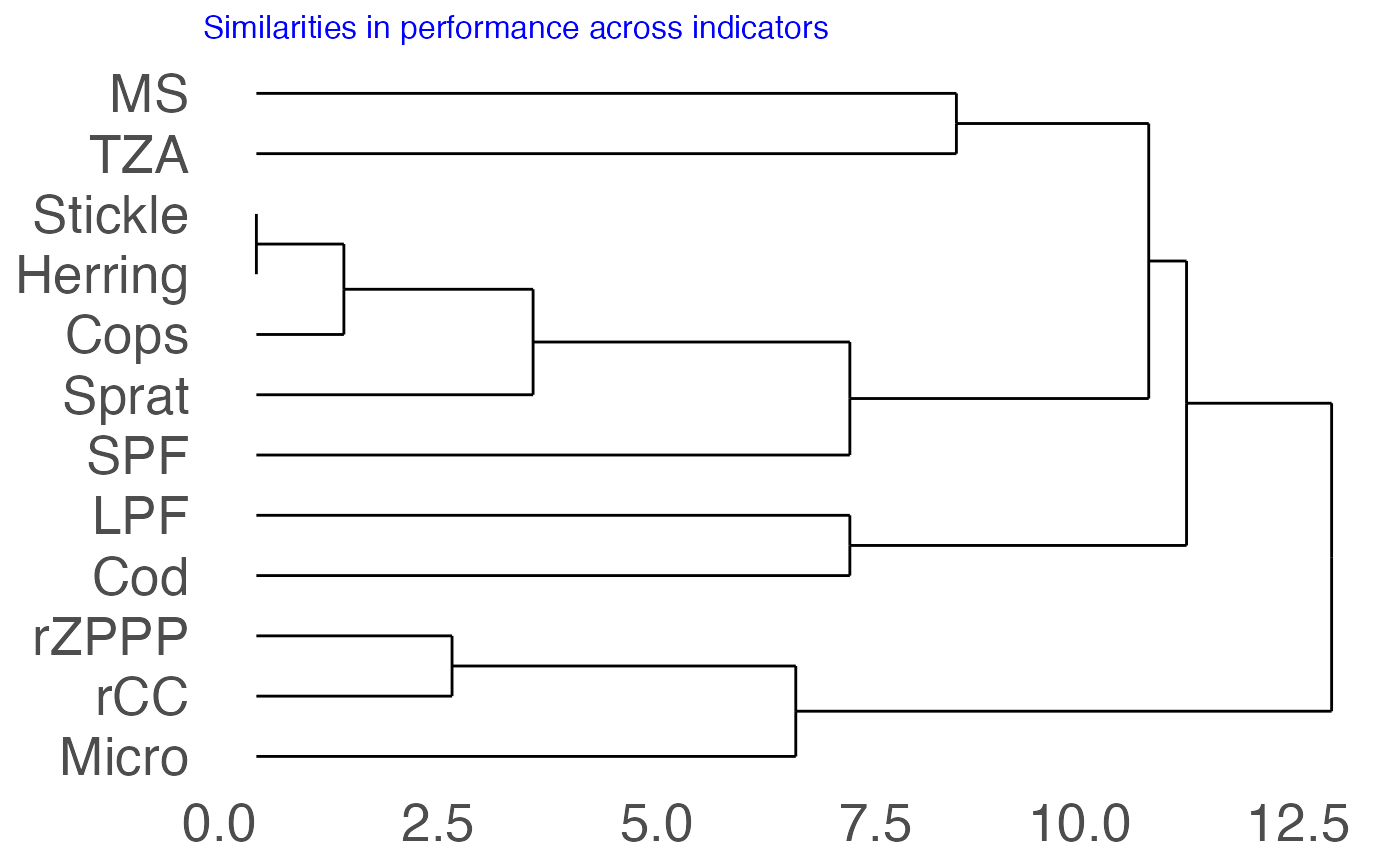
plot_clust_sc(x, rotate = FALSE, text_size = 15)
Arguments
| x | Output from the cluster analysis (object of class |
|---|---|
| rotate | If TRUE, rotates plot by 90 degrees. |
| text_size | Size of the title and axes labels. |
Value
The function returns a ggplot object.
See also
ggplot, dendro_data
for the data extraction from the hclust object to produce the dendrogram
Other score-based IND performance functions:
clust_sc(),
dist_sc_group(),
dist_sc(),
expect_resp(),
plot_spiechart(),
scoring(),
summary_sc()
Examples
# Using the Baltic Sea demo data scores_tbl <- scoring(trend_tbl = model_trend_ex, mod_tbl = all_results_ex, press_type = press_type_ex) scores_mat <- summary_sc(scores_tbl)$scores_matrix dist_matrix <- dist_sc(scores_mat, method_dist = "euclidean") clust_analysis <- clust_sc(dist_matrix, method_clust = "complete")#>plot_clust_sc(clust_analysis)# To modify the plot: plot_clust_sc(clust_analysis, rotate = TRUE, text_size = 20) + ggplot2::theme(title = ggplot2::element_text(colour = "blue", size = 10))