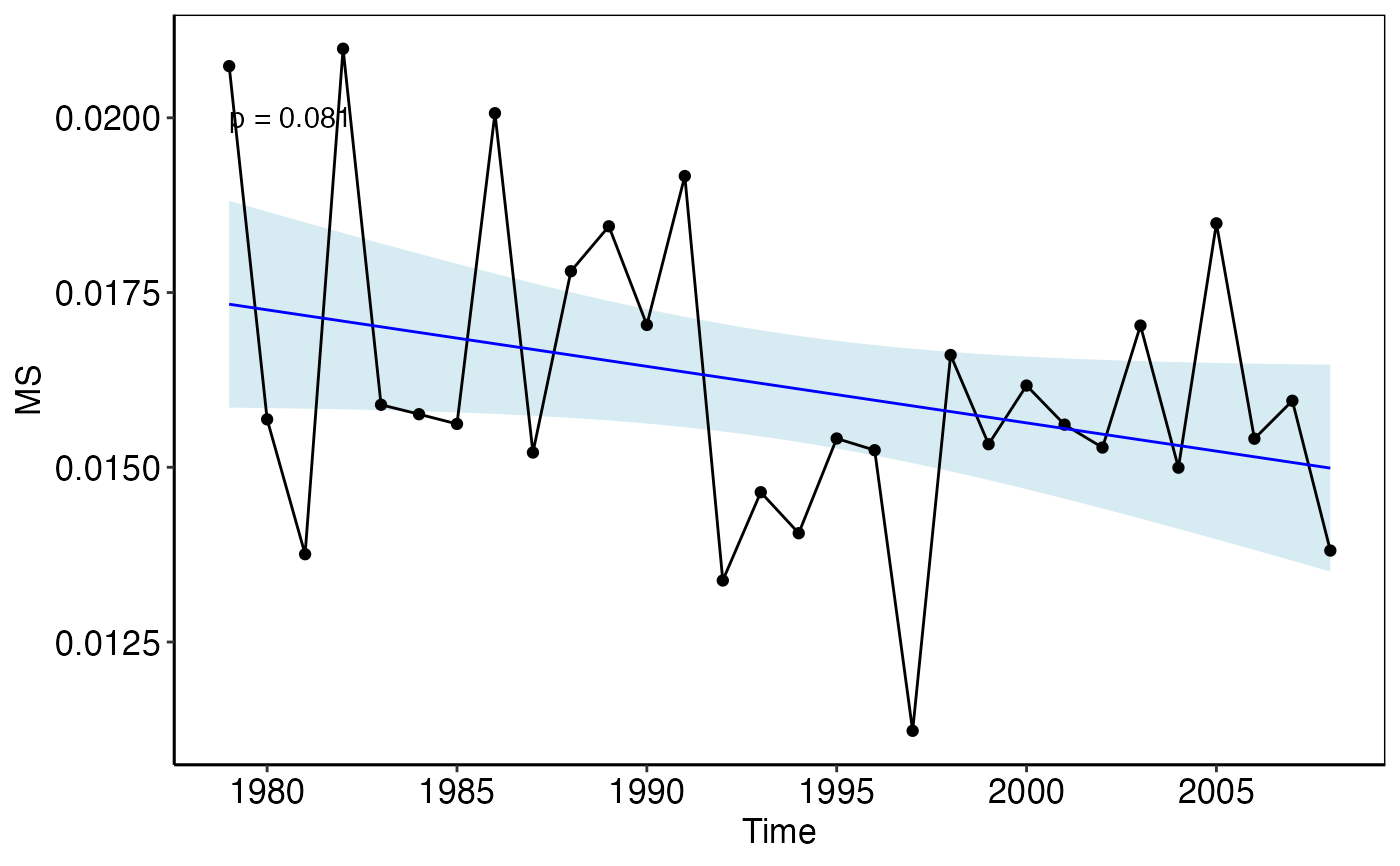
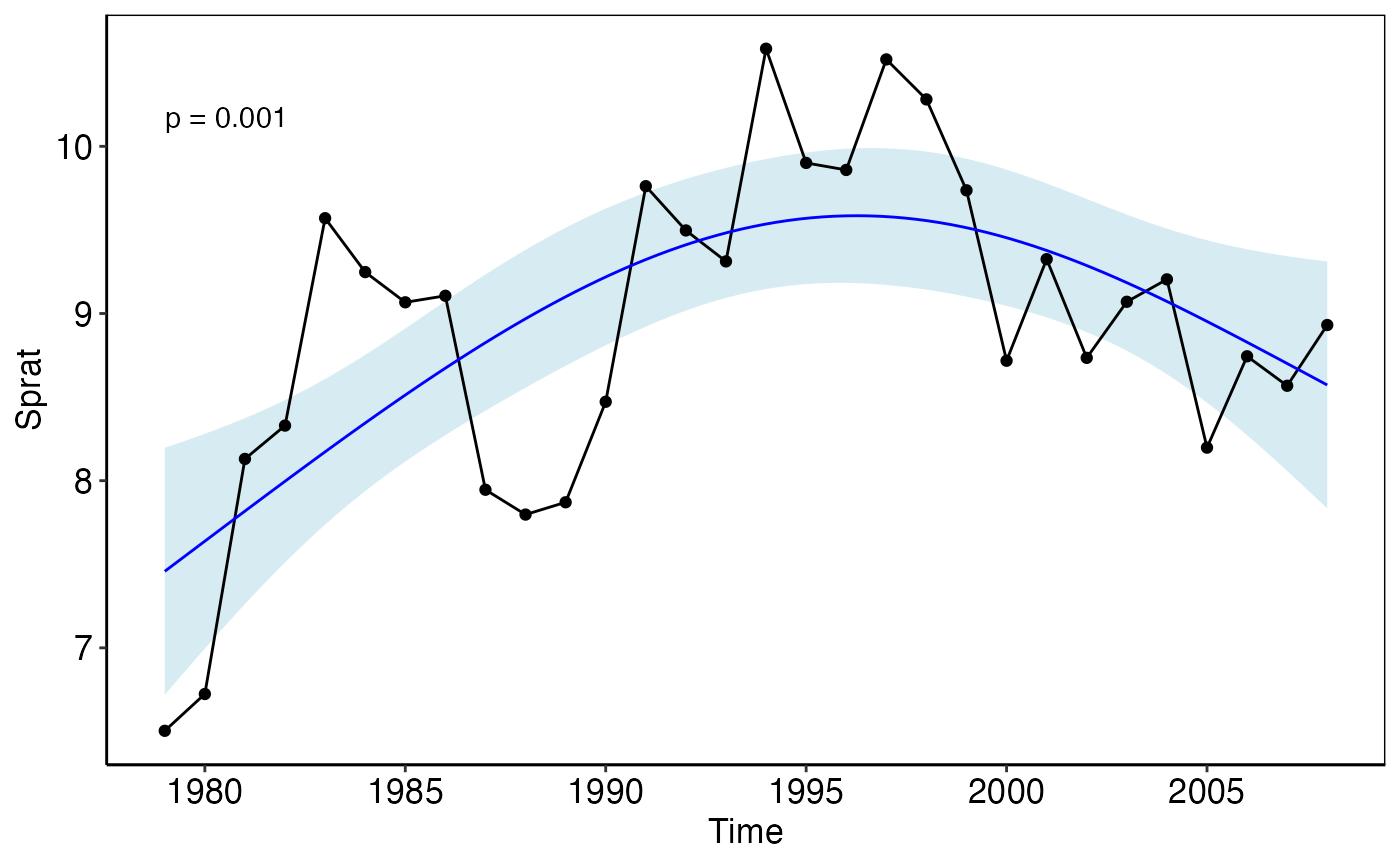
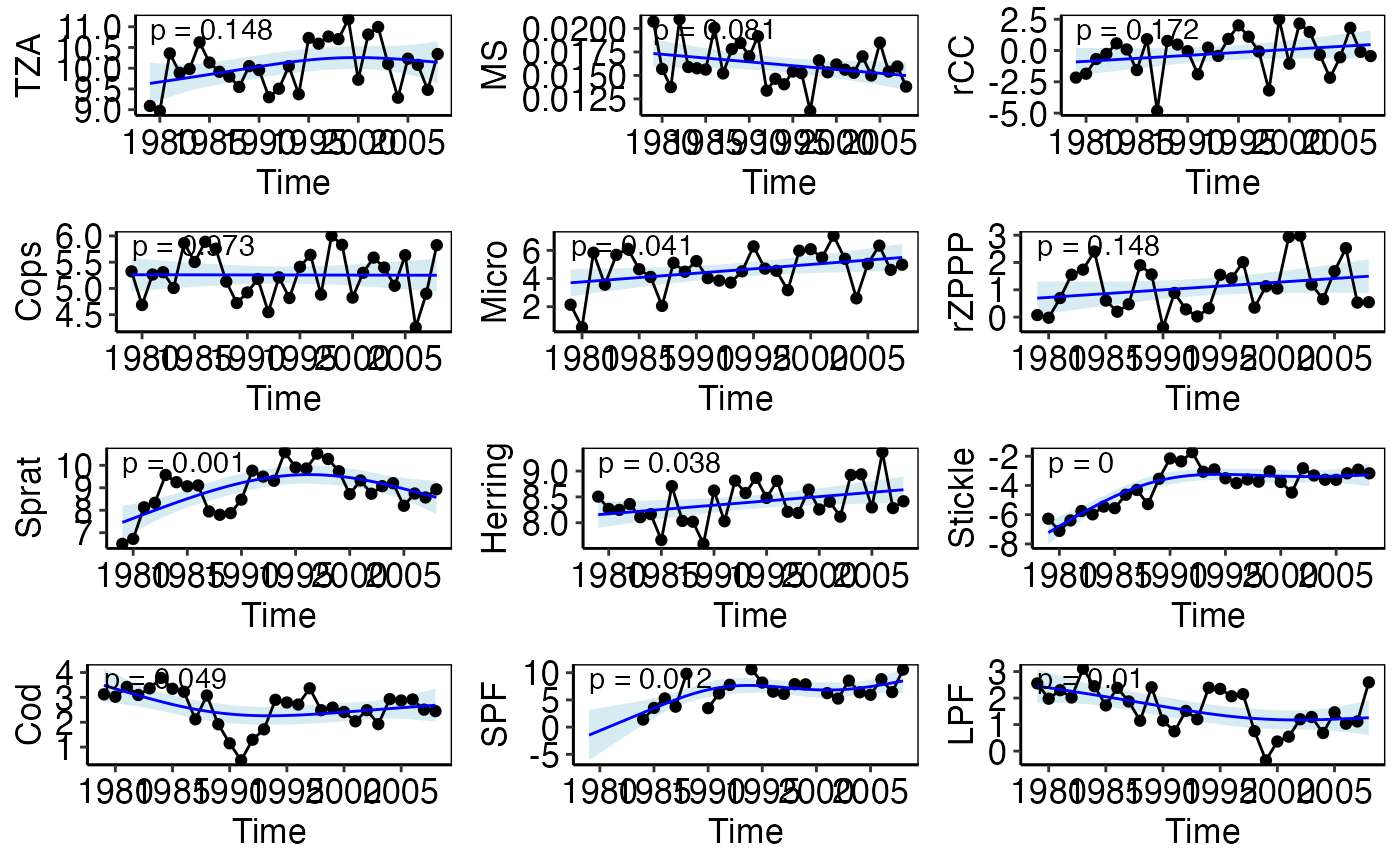
plot_trend creates for each indicator (IND) in the input tibble a
time series plot including the smoothed trend with 95% confidence interval
and the corresponding p- value based on the IND ~ time GAM.
plot_trend(trend_tbl, pos_label = "topleft")
Arguments
| trend_tbl | Output tibble from the |
|---|---|
| pos_label | Specifies the position of the annotation in the plot. Should
be one of "topleft" (default), "topright", "bottomleft" or "bottomright".
For more details see |
Value
The function returns a list of ggplot objects;
one for each indicator.
See also
model_trend that generates the model tibble for this function
Examples
# Using the example data trend_tbl <- model_trend_ex pt <- plot_trend(trend_tbl) # Show single plots using indicator names or indices pt[[2]]pt$Sprat#> Warning: Removed 5 row(s) containing missing values (geom_path).#> Warning: Removed 8 rows containing missing values (geom_point).