These are the actual plotting functions for each of the 4 plots shown
in the wrapper function plot_model. plot_thresh
works currently only for threshold-GAMs but not for threshold_GAMMs.
plot_thresh(thresh_sublist, choose_thresh_gam)

plot_response(
  x,
  y,
  x_seq,
  pred,
  ci_up,
  ci_low,
  xlab,
  ylab,
  pos_text,
  label,
  title = "Response curve S"
)

plot_predict(
  x,
  y_obs,
  y_pred,
  ci_up,
  ci_low,
  x_train,
  x_test,
  zoom,
  x_range,
  y_range,
  xlab,
  ylab,
  pos_text,
  label,
  title = "Predictive performance"
)

plot_deriv(
  press_seq,
  deriv1,
  deriv1_ci_low,
  deriv1_ci_up,
  zic_start_end,
  zero_in_conf,
  xlab,
  ylab,
  pos_text,
  label
)

plot_all_mod(p1, p2, p3, p4, title)
See also
Examples
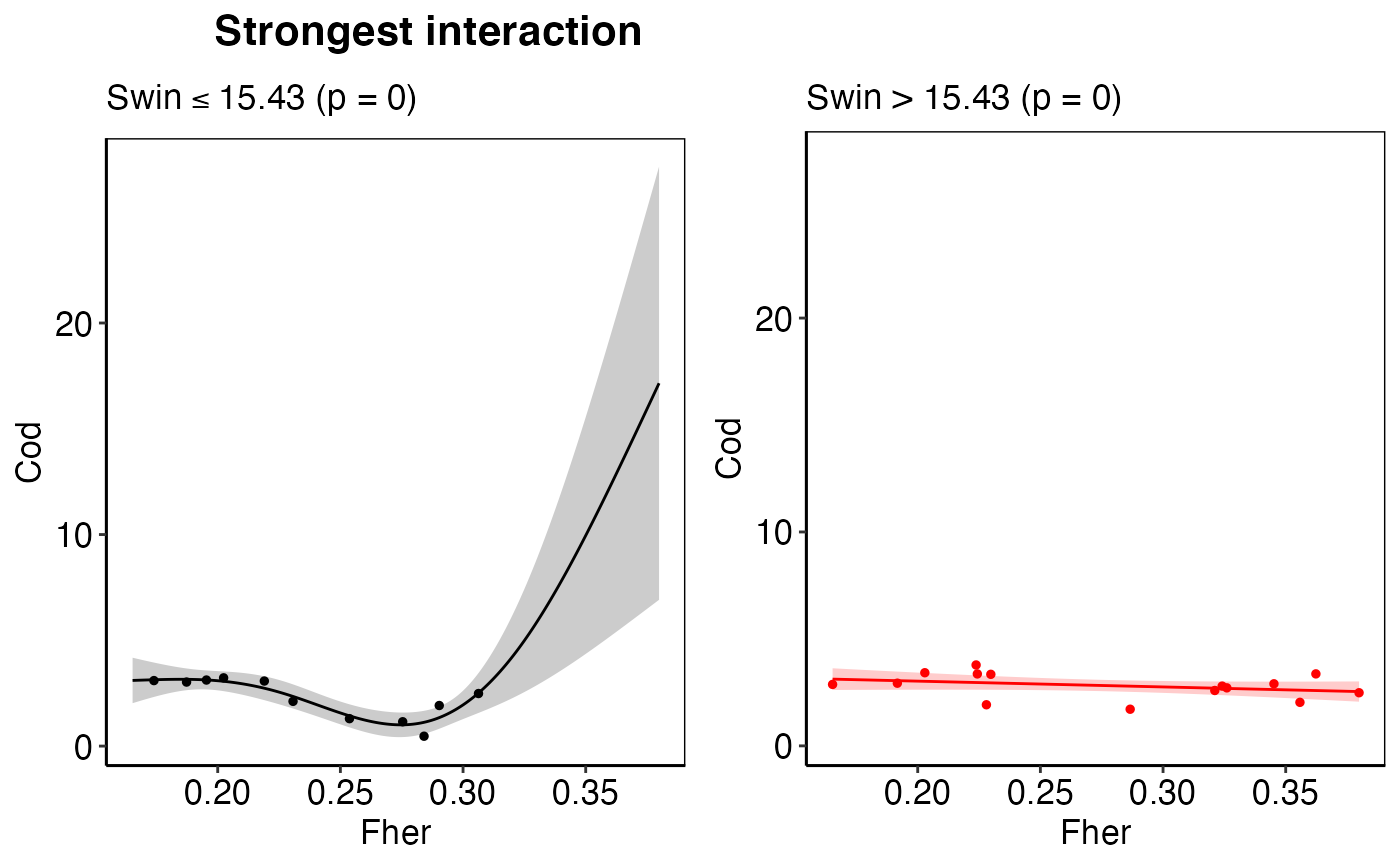
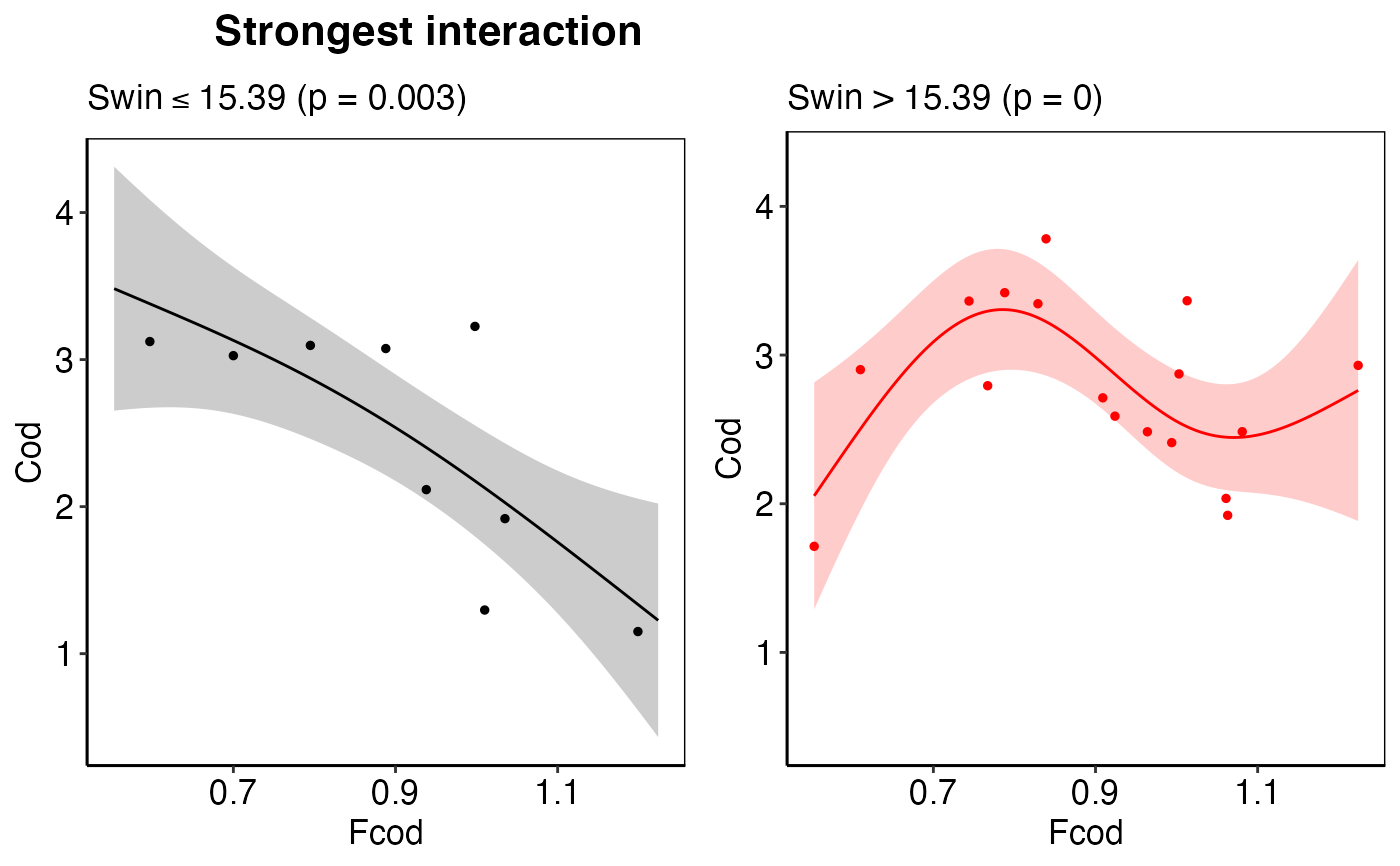
# Example for dealing with nested list-columns using the # Baltic Sea demo data thresh_sublist1 <- all_results_ex$thresh_models[[69]] thresh_sublist2 <- all_results_ex$thresh_models[[70]] thresh_sublist <- list(thresh_sublist1, thresh_sublist2) %>% purrr::flatten(.) plot_thresh(thresh_sublist, choose_thresh_gam = NULL)plot_thresh(thresh_sublist, choose_thresh_gam = 1)plot_thresh(thresh_sublist, choose_thresh_gam = 2)