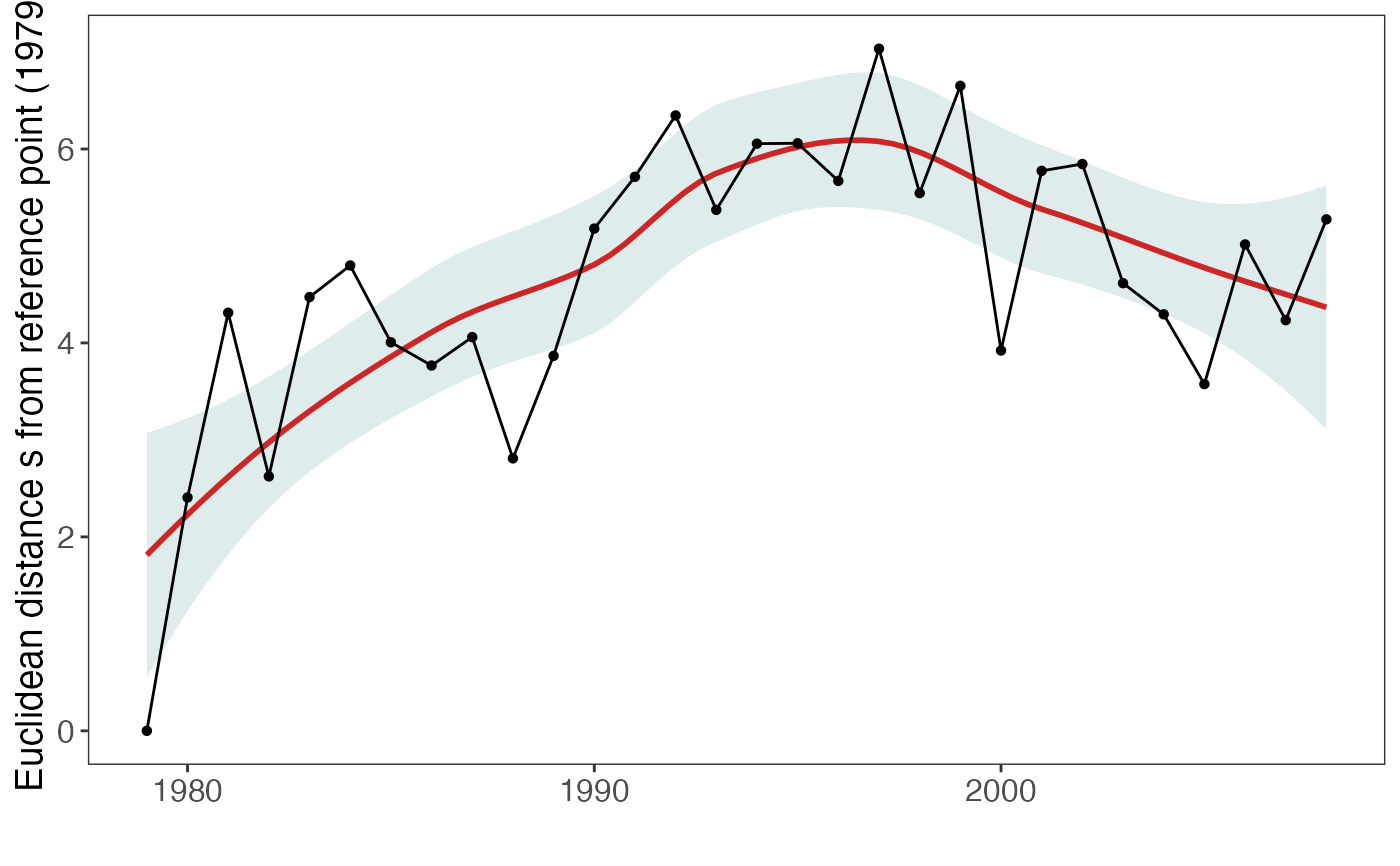
plot_statespace_ed generates a time series plot of the Euclidean
distance in indicator state space from a defined reference conditions.
plot_statespace_ed(x)
Arguments
| x | The output tibble from the |
|---|
Value
The function returns a ggplot object.
See also
Other state assessment functions:
plot_statespace_ch(),
statespace_ch(),
statespace_ed()
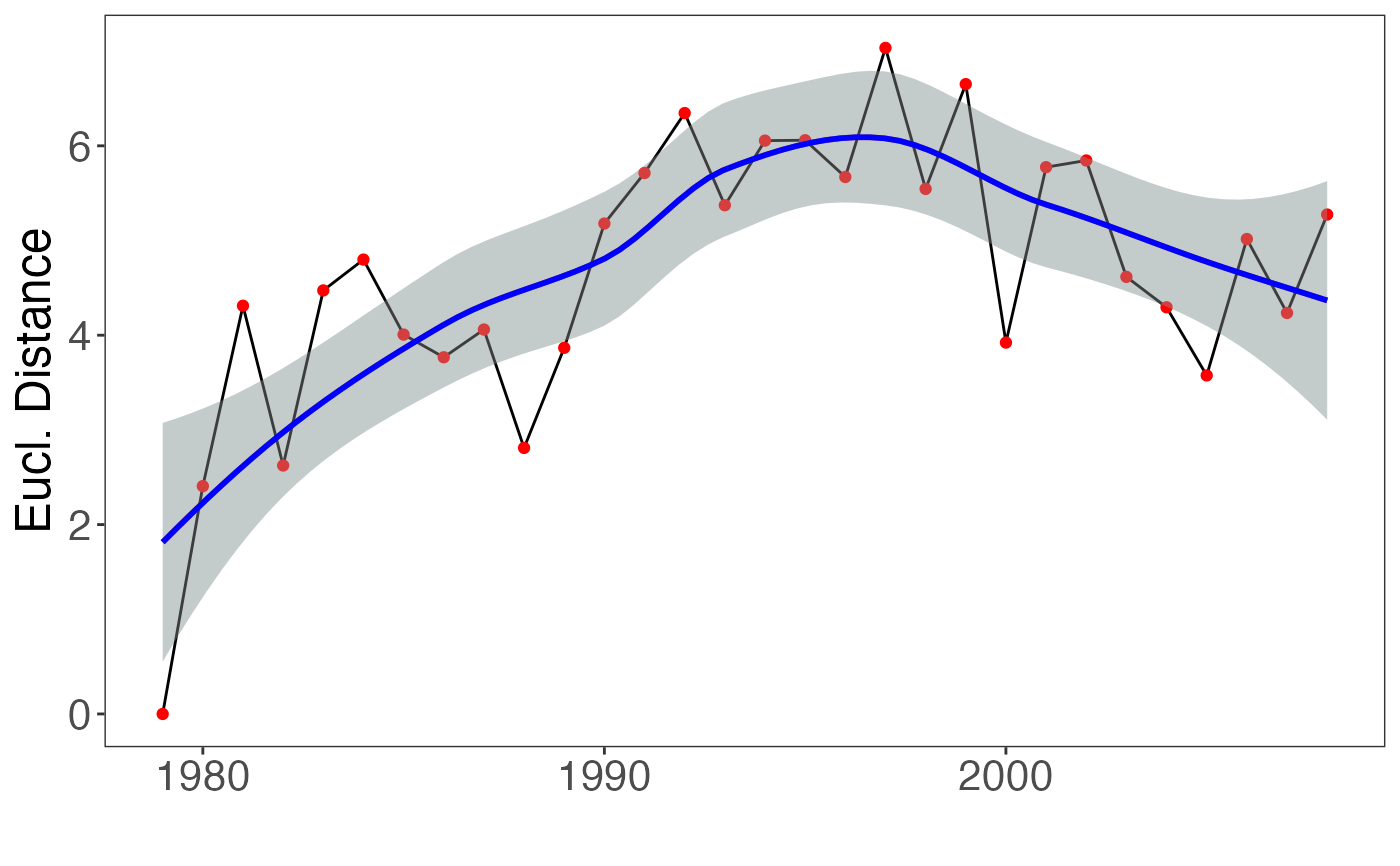
Examples
# Using the Baltic Sea demo data in the package ind_sel <- ind_ex[,c(2,3,4,8,10,11)] # --> selection of complementary and well performing indicators ed <- statespace_ed(x = ind_sel, time = ind_ex$Year, ref_time = ind_ex$Year[1]) plot_statespace_ed(x = ed)#># To modify the plot: p <- plot_statespace_ed(x = ed) p + ggplot2::geom_point(col = "red") + ggplot2::ylab("Eucl. Distance") + ggplot2::geom_smooth(col="blue") + ggplot2::theme(axis.text = ggplot2::element_text(size = 16), axis.title=ggplot2::element_text(size = 18))#>#>