
Lineares Modell mit Kovariate(n) & fixem Faktor
DS3 - Explorative Datenanalyse & Data Mining
Saskia Otto
Universität Hamburg, IMF
Wintersemester 2023/2024
Lernziele
![]()
Am Ende dieser VL- und Übungseinheit werden Sie
- wissen, was die ANCOVA mit einer Regression und ANOVA verbindet bzw. davon unterscheidet.
- die Gründe für die Verwendung einer ANCOVA und ihre Anwendungsgebiete kennen.
- zwischen abhängiger Variable, unabhängiger kategorialer Variable (Faktor) und Kovariate (kontinuierliche Variable) unterscheiden können und die Rolle jeder Variable im ANCOVA-Modell verstehen.
- gelernt haben, wie man ein ANCOVA-Modell in R erstellt und spezifiziert, einschließlich der Einbeziehung von Interaktionstermen, und die Ergebnisse interpretiert.
- den Ablauf einer Modellselektion vertieft haben.
- das Prinzip der Dummy-Variablen kennengelernt haben.
Kovariate & fixen Faktor: Kovarianzanalyse

Kovarianzanalyse oder ANCOVA
Ein Hybrid aus ANOVA und linearer Regression
- Die Antwortvariable Y ist kontinuierlich.
- Es gibt mindestens eine kontinuierliche (Kovariate) und eine kategoriale (Faktor) erklärende Variable X.
- Einige betrachten ANCOVA als ein “ANOVA”-Modell mit einer zusätzlichen Kovariate → Fokus auf den Faktorstufen, bereinigt um die Kovariate (z. B. Quinn & Keough, 2002)
- Andere betrachten es als “Regressions”-Modell mit einem kategorialen Prädiktor → Fokus auf der Kovariate, bereinigt um den Faktor (z. B. Crawley 2005, 2007)
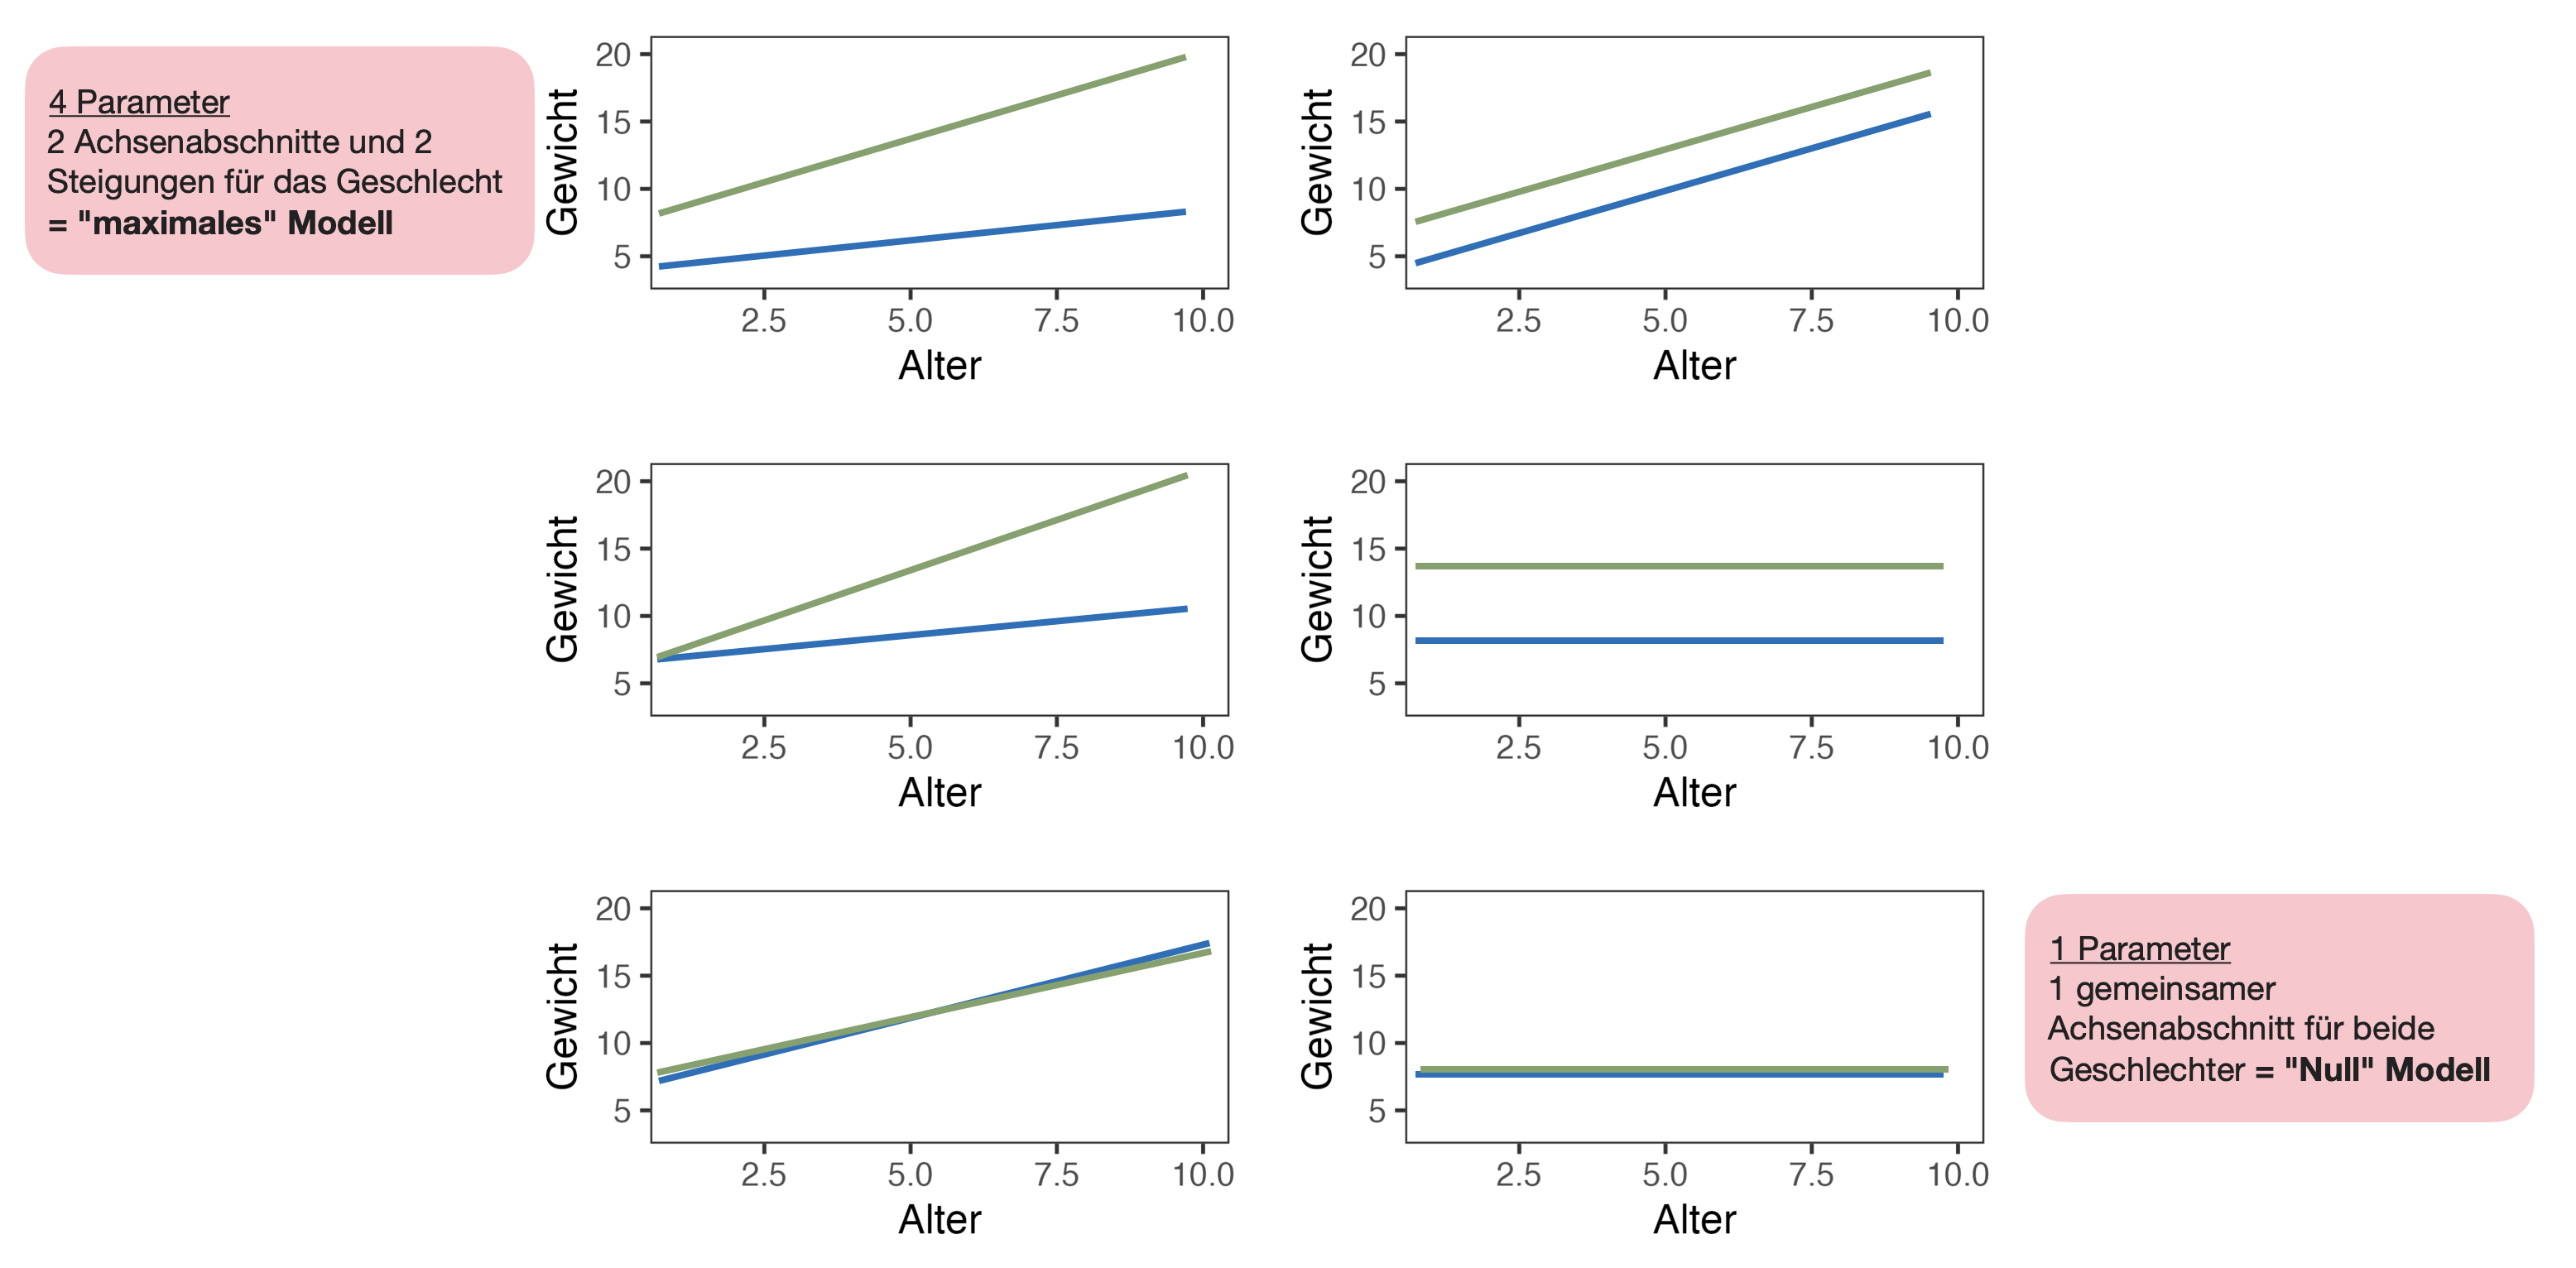
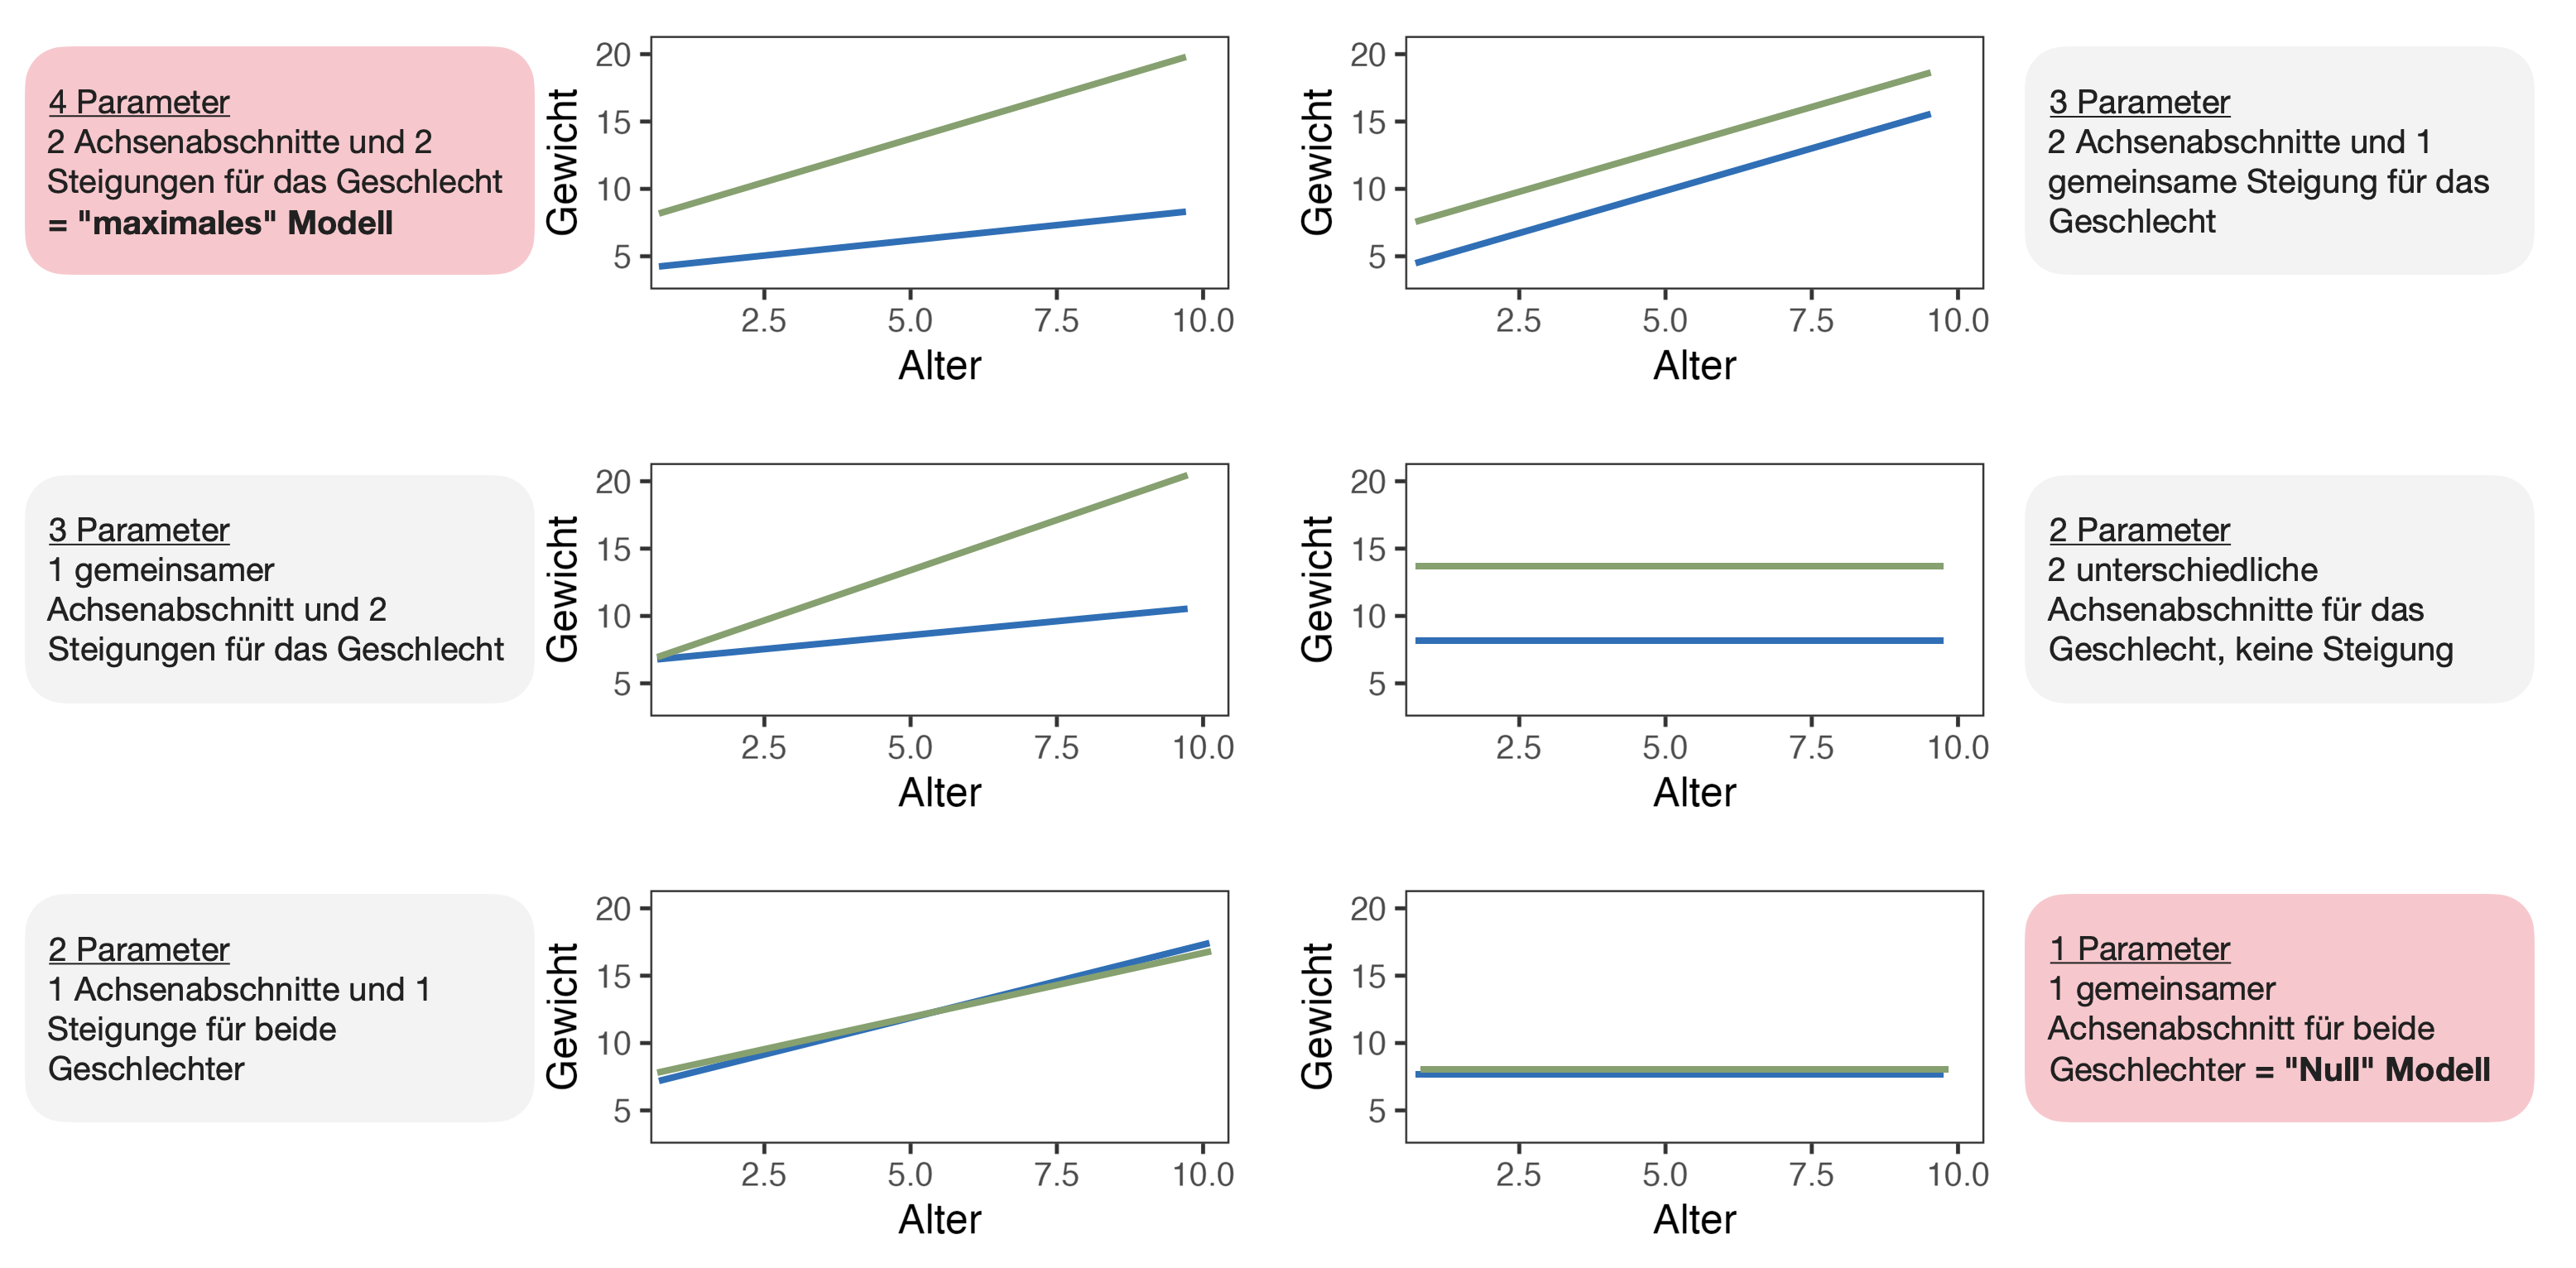
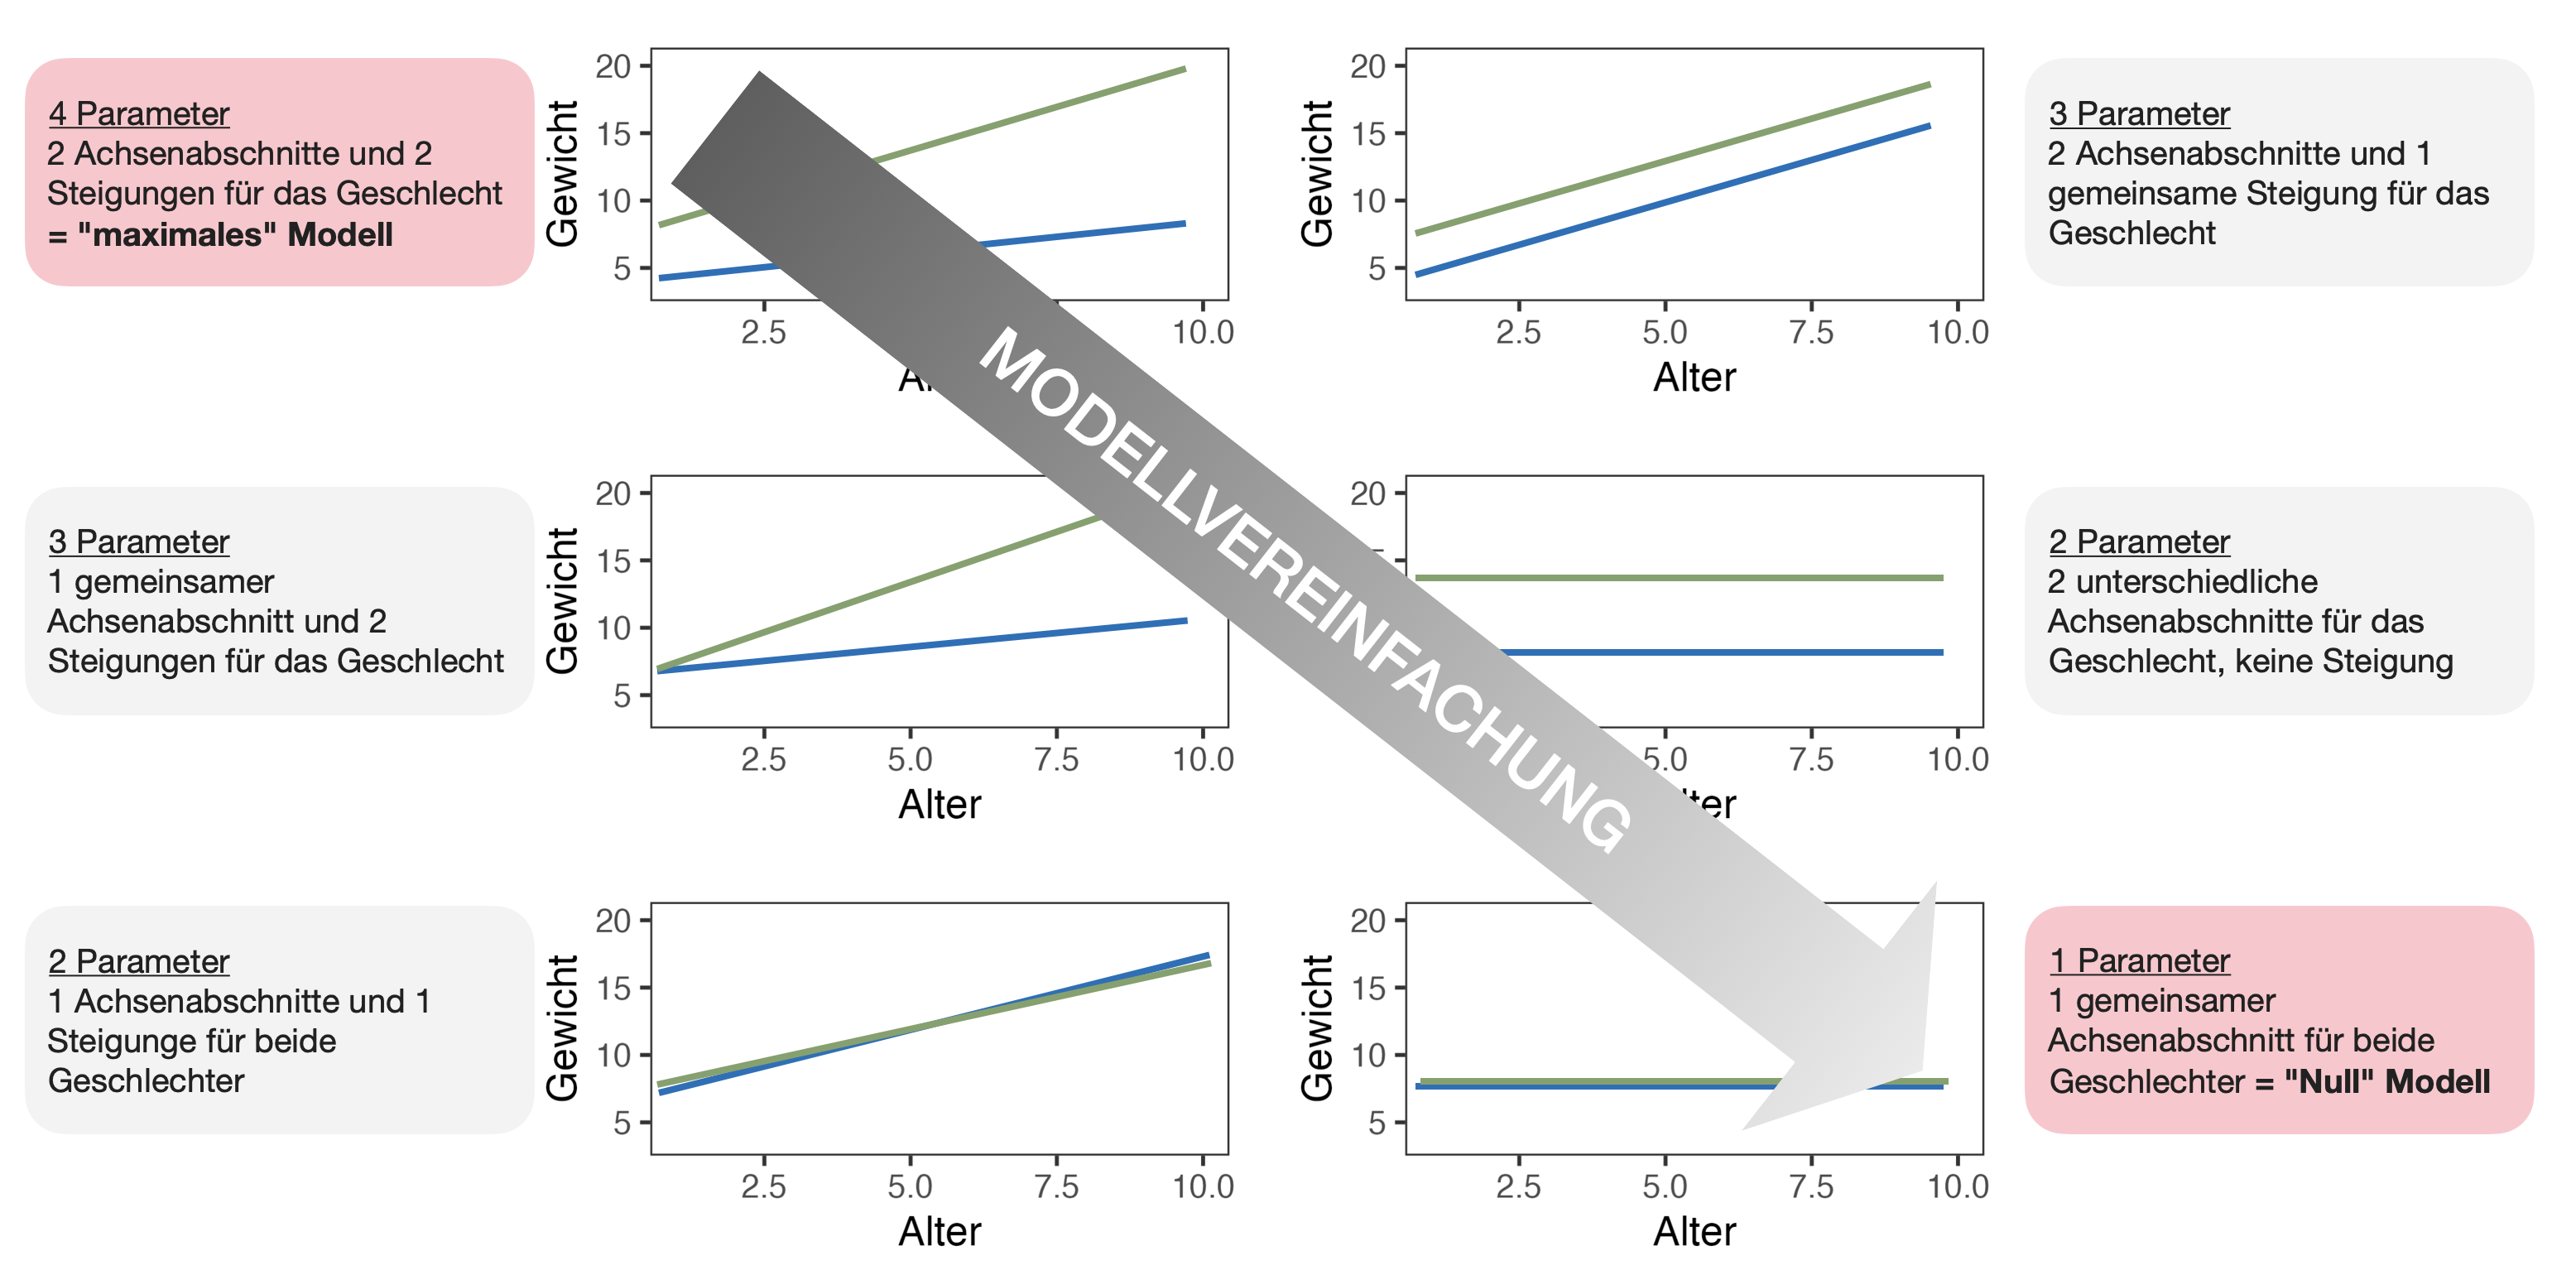
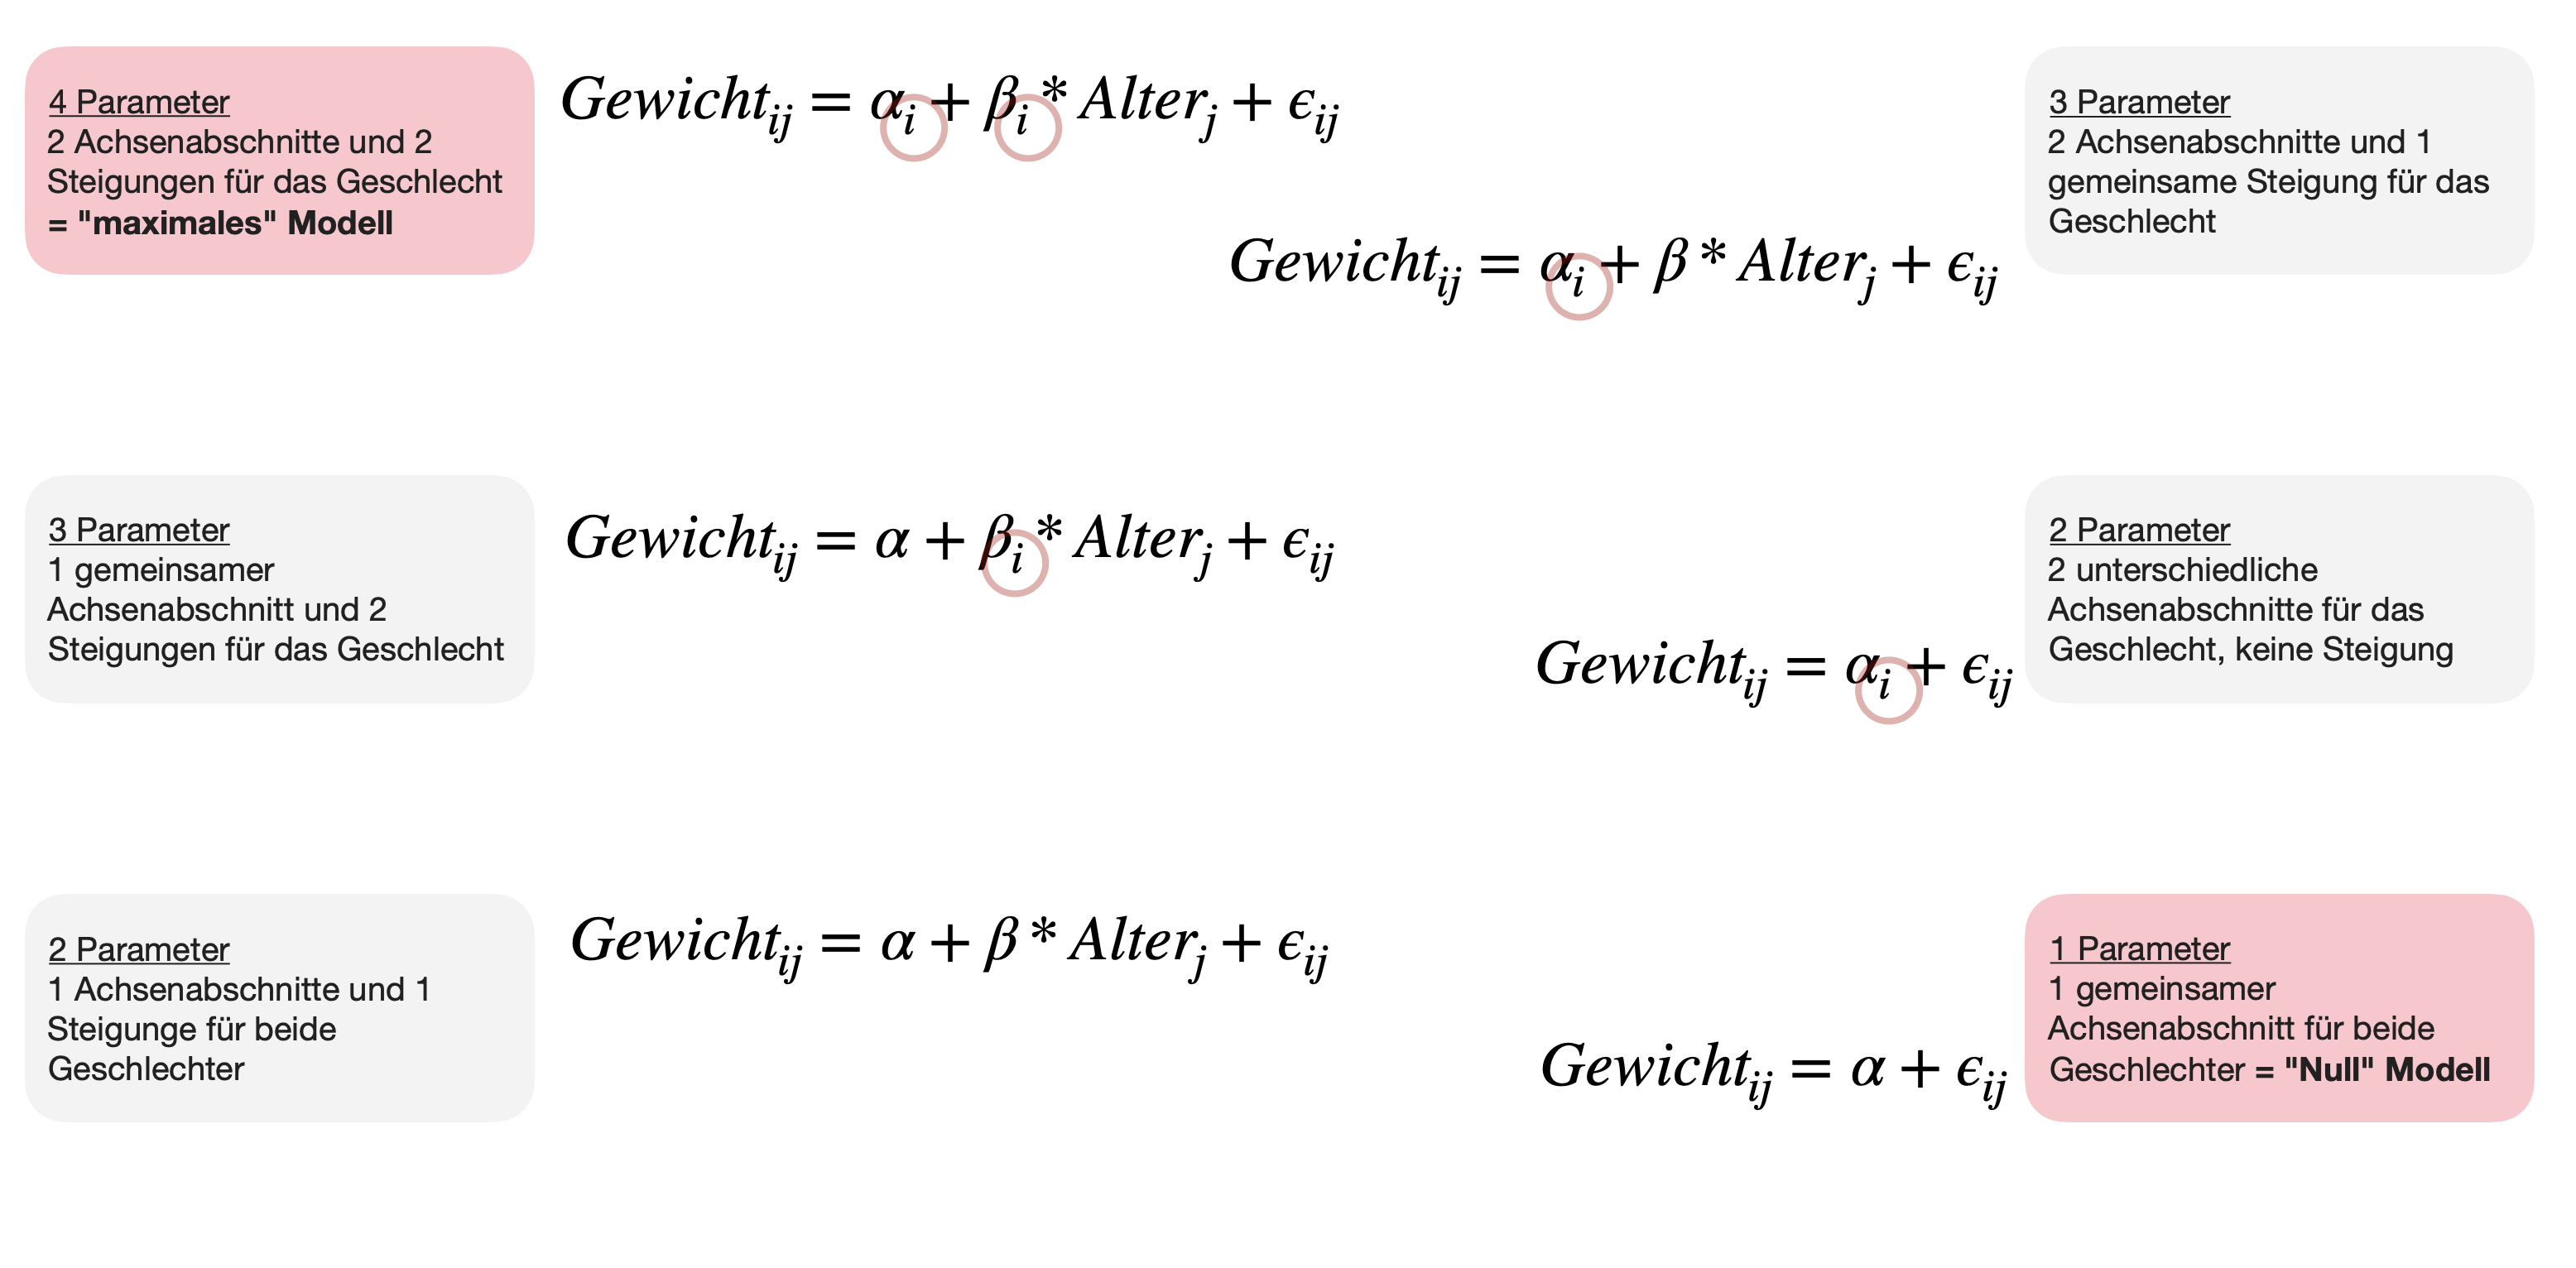
- Das typische “Maximal”-Modell beinhaltet die Schätzung eines Achsenabschnitts und einer Steigung (Regressionsteil) für jede Stufe der kategorialen Variable(n) (ANOVA-Teil).
- Der Faktor in einer ANCOVA ist immer fest; bei einem zufälligen Faktor spricht man von einem Linearen Gemischten Effektmodell.
Die Regressionsgleichung
Bsp.: Gewicht in Abhängigkeit von Alter und Geschlecht

Hybrid aus ANOVA und linearer Regression
Bsp.: Gewicht in Abhängigkeit von Alter und Geschlecht

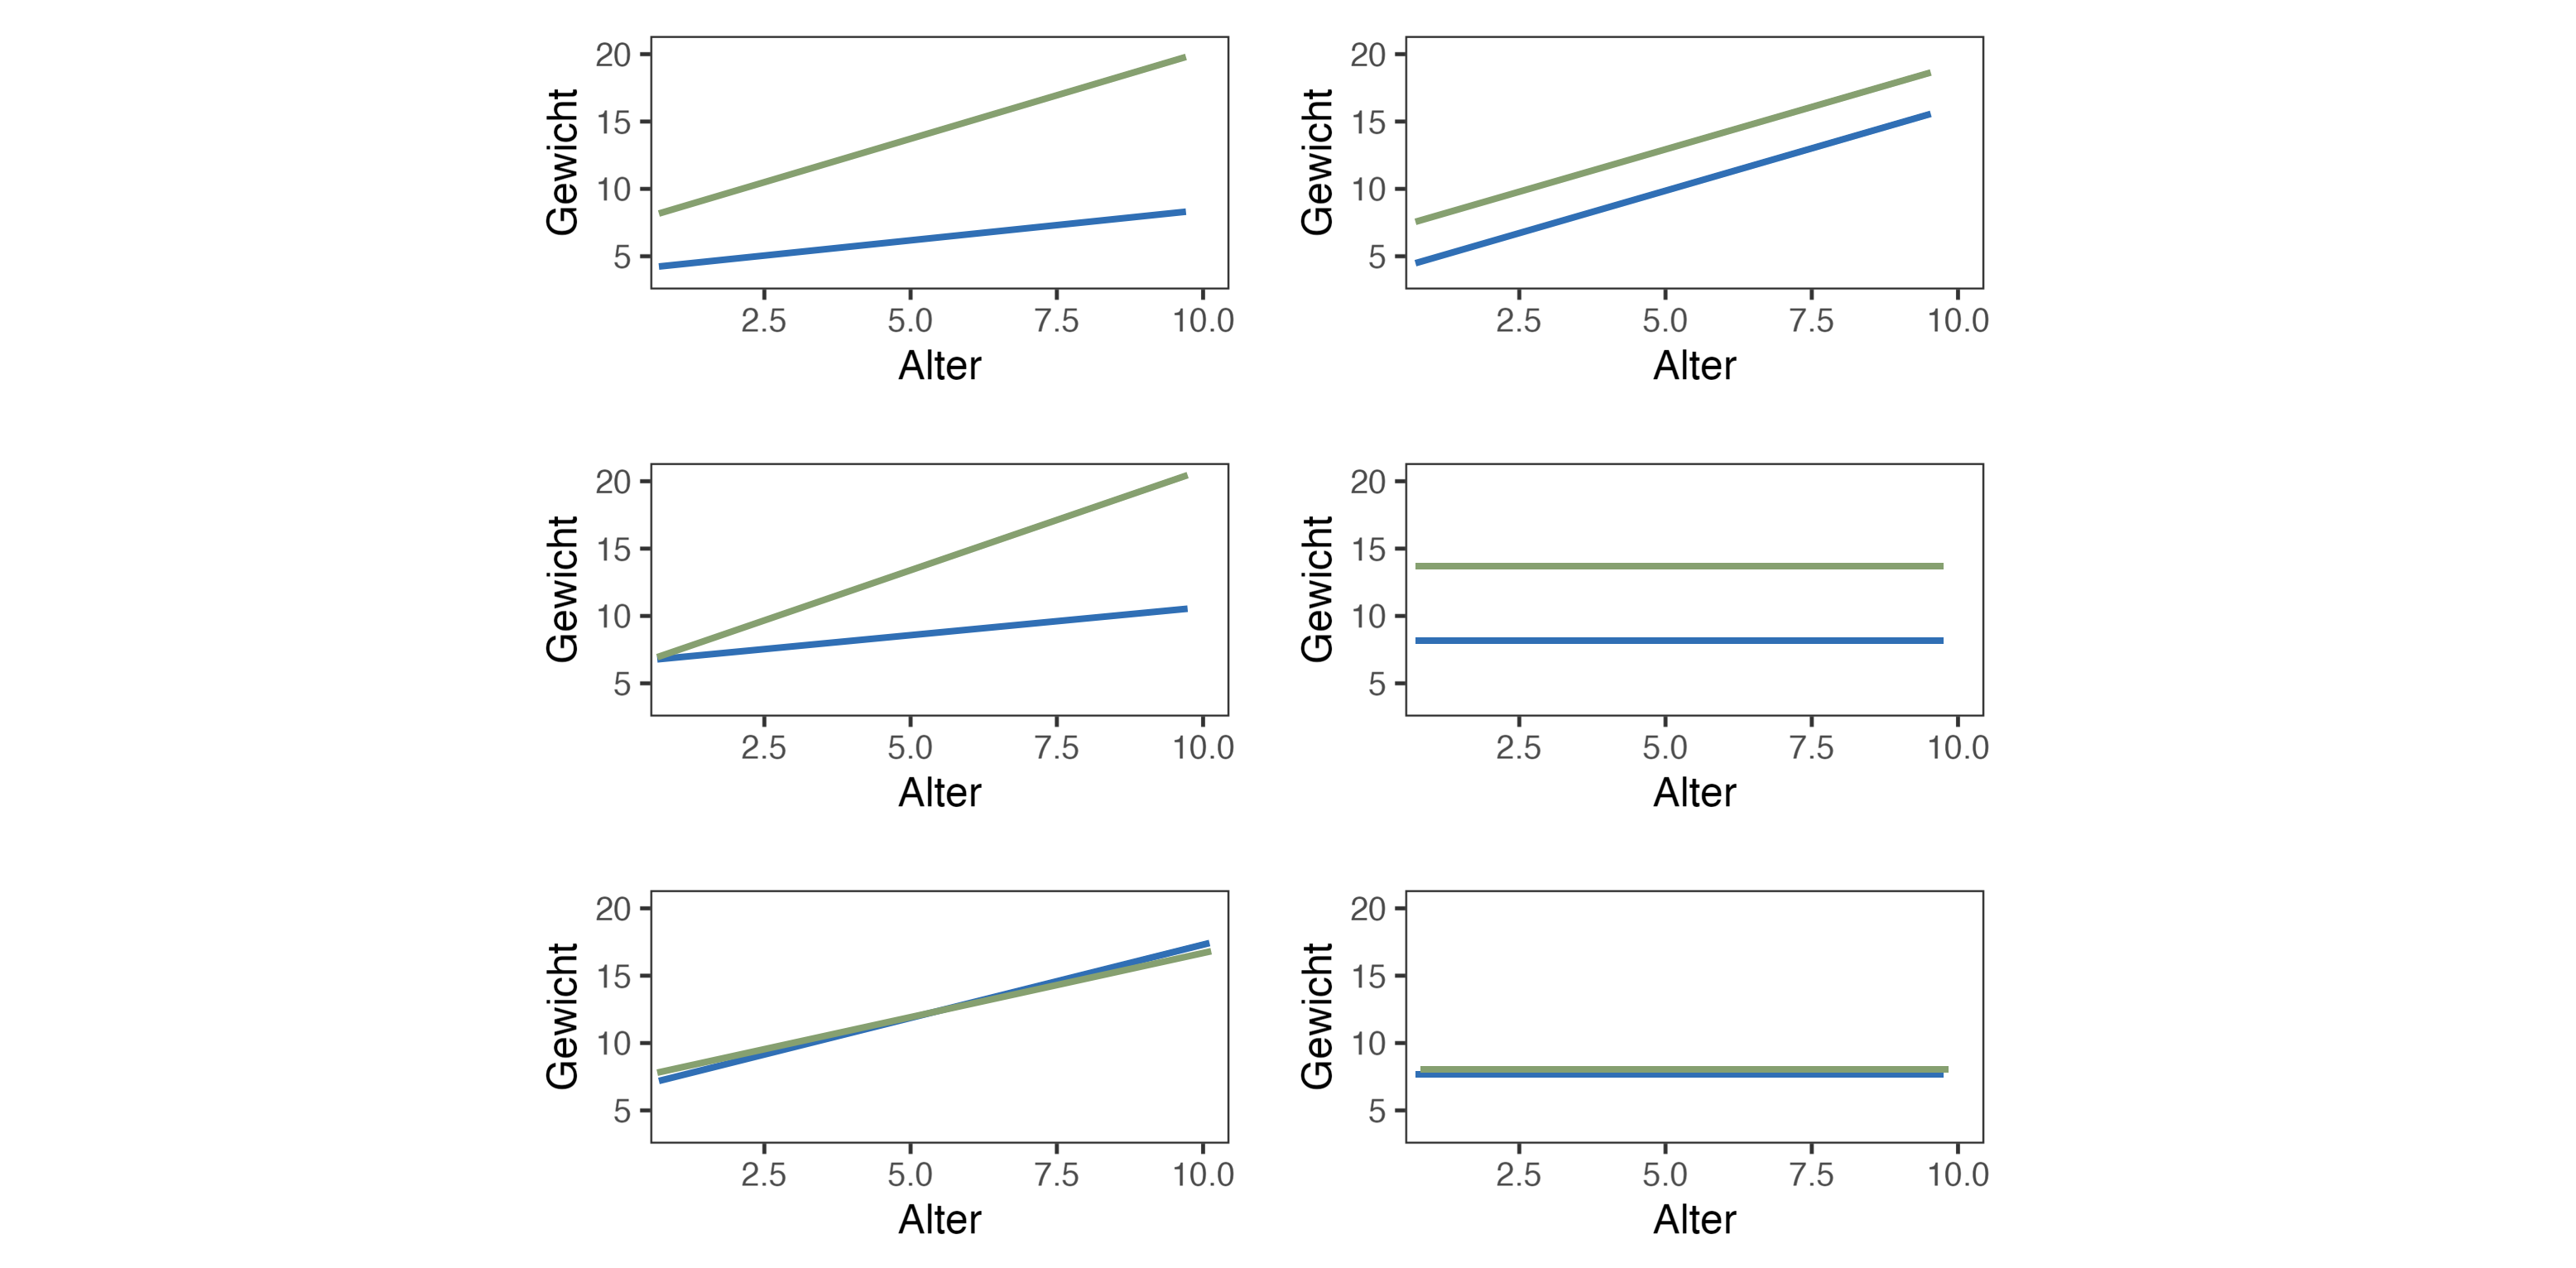
6 mögliche Modelle
Bsp.: Gewicht in Abhängigkeit von Alter und Geschlecht
Nullhypothesen der ANCOVA
Achsenabschnitt
H0: \alpha_1 = \alpha_2 = .. = \alpha_i
- Bei 2 Achsenabschnitten: t-Test
- Bei ≥ 3 Achsenabschnitten: ANOVA (F-Test)
Steigung
H0: \beta_1 = \beta_2 = .. = \beta_i
- Bei 2 Steigungen: t-Test
- Bei ≥ 3 Steigungen: ANOVA (F-Test)
Herangehensweise in R

- Lineare Regression (Y ~ X) für jede Faktorstufe mittels
lm()Funktion. - Schätzung der Koeffizienten für jede Faktorstufe im maximalen Modell.
- Vereinfachung des Modells:
- Wir passen das komplizierteste Modell zuerst an und validieren es.
- Dann vereinfachen wir es mit Hilfe eines Auswahlkriteriums wie einem F-Test oder dem AIC
- bis ein minimal adäquates Modell übrig bleibt (bei dem alle Parameter signifikant von Null verschieden sind), welches wir auch noch mal validieren.
- R-Funktionen für Modellvergleich:
- F-Test →
drop1(mod_full, test = "F")oderanova(mod_full, mod_red)(Modelle müssen verschachtelt sein) - AIC →
AIC(mod_full, mod_red)bzw.step(mod_full)(automatische Auswahl)
- F-Test →
Längen-Gewichts-Beziehungen | 1
Ein typisches Beispiel für eine Beziehung, die nicht mit einer linearen Grafik dargestellt werden kann, ist in der Biologie die Beziehung zwischen dem Gewicht (W) eines Tieres (z.B. eines Fisches) und seiner Länge (L).
Für die meisten Arten folgt sie einer 2-Parameter Powerfunktion: W = aL^{b}
Beispiel: Königslachse
Längen und Gewichte für Königslachse von drei Orten in Argentinien (Daten sind aus dem FSA)*. 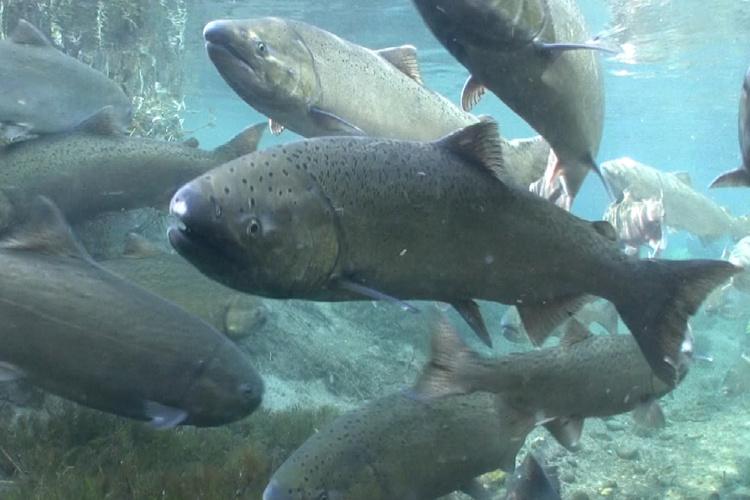

*Originalartikel zum Datensatz: Soto, D., I. Arismendi, C. Di Prinzio, & F. Jara (2007): Establishment of Chinook Salmon (Oncorhynchus tshawytscha) in Pacific basins of southern South America and its potential ecosystem implications. Revista Chilena d Historia Natural, 80:81-98. Link
Längen-Gewichts-Beziehungen | 2
Logarithmus-Transformation
Die Potenzfunktion wird linear, wenn man sie doppelt logarithmiert!
Beispiel: Königslachse
\begin{align} W &= aL^{b} \\ ln(W) &= ln(aL^{b})\\ ln(W) &= ln(a) + b*ln(L)\\ \Rightarrow Y &= a + b*X \end{align}

Königslachse | Fragestellung
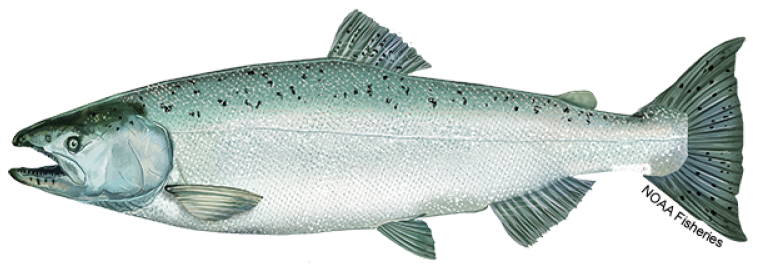
- Frage 1: Unterscheiden sich die Lachse der 3 Beprobungsorte in ihrem durchschnittlichen Gewicht? →ANOVA
- Frage 2: Wie ist die Längen-Gewichts-Beziehung bei den gemessenen Königslachsen? →Regression
- Frage 3: Unterscheidet sich diese Beziehung zwischen Individuen der 3 Beprobungsorte (Río Petrohuyé, Lago Puyehue, Río Futaleufú en Argentina)? → Interaktion
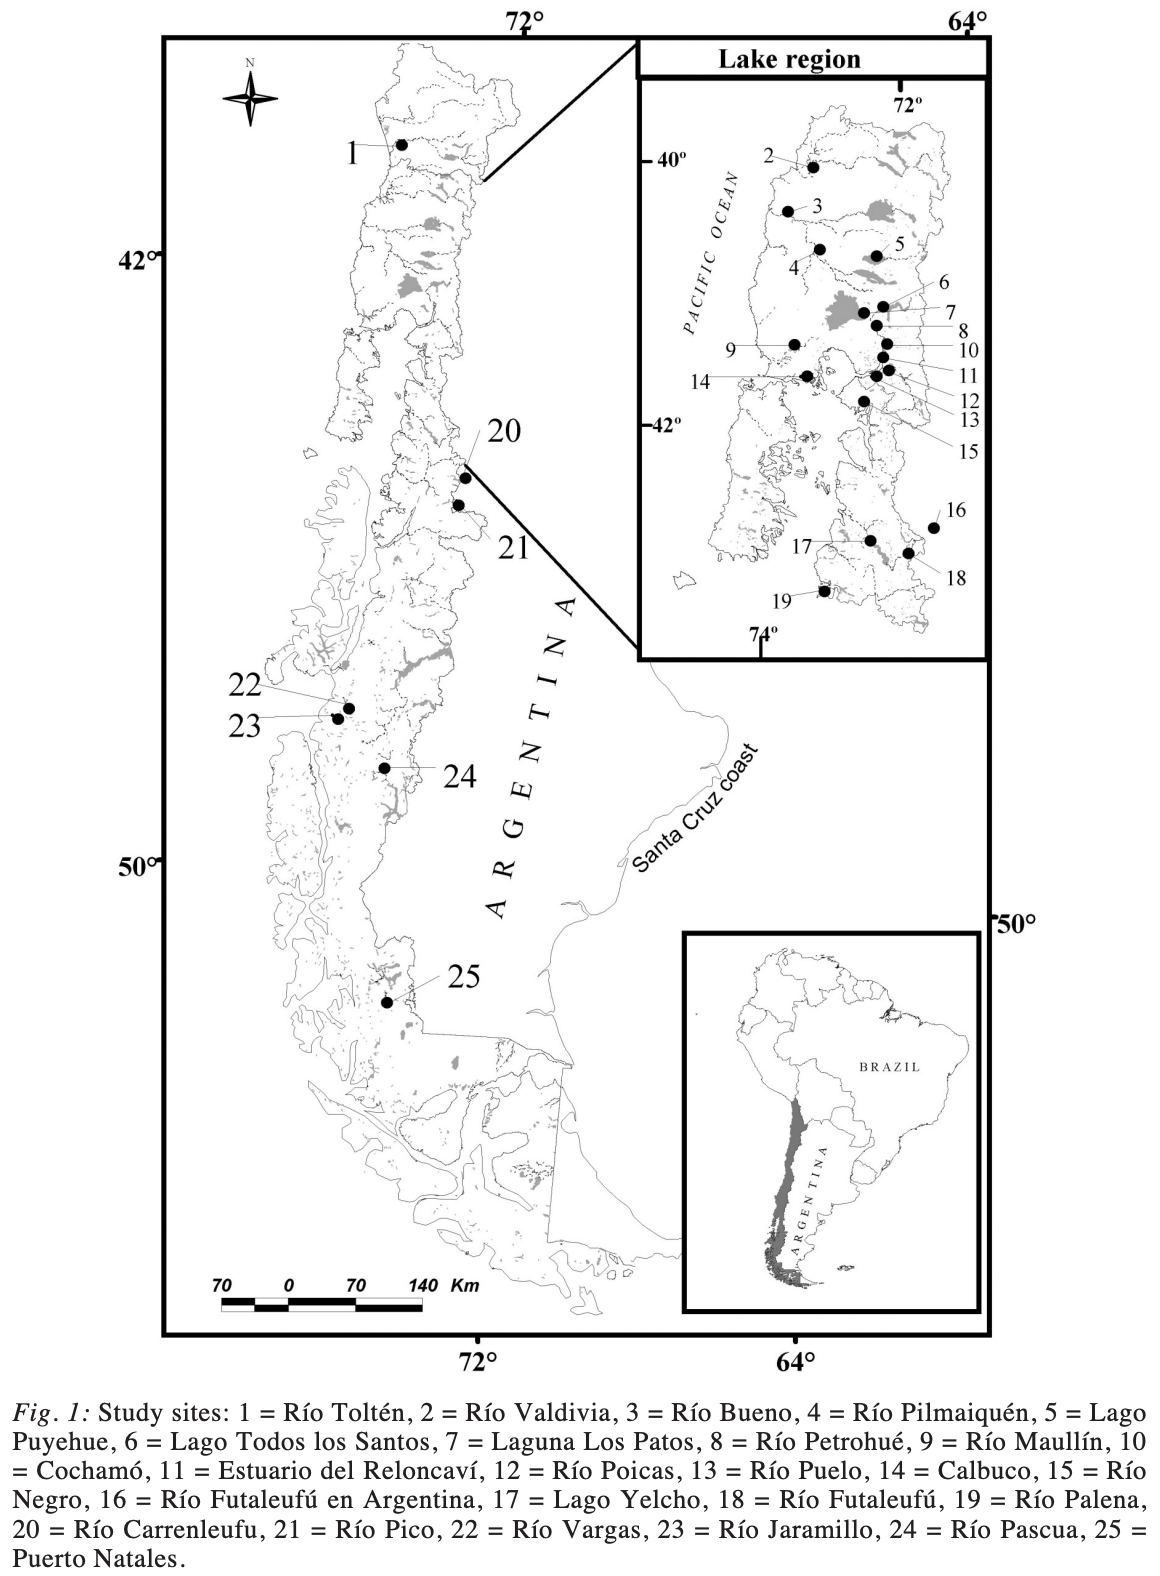
Aus Soto et al. (2007)
Königslachse | Das Maximalmodell

Wir starten mit dem Maximalmodell, welches
- den Beprobungsort (Faktor
loc= location), - die Länge (Kovariate
tl_ln= total length in cm, logarithmiert) und - den Interaktionsterm enthält.
- Unsere Antwortvariable ist
w_ln(=weight in kg, logarithmiert).
Validierung des Maximalmodells

Ergebnisse des Maximalmodells

Analysis of Variance Table

Response: w_ln
           Df Sum Sq Mean Sq  F value    Pr(>F)
tl_ln       1 92.083  92.083 898.4819 < 2.2e-16 ***
loc         2  2.634   1.317  12.8526 1.005e-05 ***
tl_ln:loc   2  0.101   0.051   0.4932     0.612
Residuals 106 10.864   0.102
---
Signif. codes: 0 '***' 0.001 '**' 0.01 '*' 0.05 '.' 0.1 ' ' 1Single term deletions
Model:
w_ln ~ tl_ln + loc + tl_ln:loc
Df Sum of Sq RSS AIC F value Pr(>F)
<none> 10.864 -249.31
tl_ln:loc 2 0.1011 10.965 -252.27 0.4932 0.612Aus diesen beiden Funktionen können wir den p-Wert für den Faktor bzw. die Interaktion entnehmen!
Call:
lm(formula = w_ln ~ tl_ln + loc + tl_ln:loc, data = ChinookArg)

Residuals:
     Min       1Q   Median       3Q      Max
-0.58273 -0.18471 -0.00186  0.13088  1.63620

Coefficients:
                  Estimate Std. Error t value Pr(>|t|)
(Intercept)        -6.6750     1.5904  -4.197 5.64e-05 ***
tl_ln               1.9836     0.3530   5.619 1.56e-07 ***
locPetrohue        -2.3957     3.1494  -0.761    0.449
locPuyehue         -2.0696     1.6868  -1.227    0.223
tl_ln:locPetrohue   0.4795     0.6928   0.692    0.490
tl_ln:locPuyehue    0.3624     0.3793   0.955    0.342
---
Signif. codes:  0 '***' 0.001 '**' 0.01 '*' 0.05 '.' 0.1 ' ' 1

Residual standard error: 0.3201 on 106 degrees of freedom
Multiple R-squared:  0.8972,    Adjusted R-squared:  0.8924
F-statistic:   185 on 5 and 106 DF,  p-value: < 2.2e-16
Hieraus entnehmen wir den p-Wert für die Kovariate!
Modellreduktion | Interaktion

Können wir die Interaktion entfernen?
Vergleich volles und reduziertes Modells mittels anova()
Analysis of Variance Table

Model 1: w_ln ~ tl_ln + loc + tl_ln:loc
Model 2: w_ln ~ tl_ln + loc
  Res.Df    RSS Df Sum of Sq      F Pr(>F)
1    106 10.864
2 108 10.965 -2 -0.1011 0.4932 0.612INTERPRETATION:
- Das vollere Modell ist NICHT signifikant besser (p = 0.612) als das reduzierte Modell.
- → Wir können den Interaktionsterm entfernen.
Modellreduktion | Faktor & Kovariate

Können wir den Faktor oder die Kovariate jetzt auch noch entfernen?
Single term deletions

Model:
w_ln ~ tl_ln + loc
       Df Sum of Sq    RSS      AIC F value    Pr(>F)
<none>              10.965 -252.267
tl_ln   1    34.175 45.140  -95.779 336.615 < 2.2e-16 ***
loc     2     2.634 13.599 -232.151  12.974 8.917e-06 ***
---
Signif. codes:  0 '***' 0.001 '**' 0.01 '*' 0.05 '.' 0.1 ' ' 1
INTERPRETATION:
- Nein, in beiden Fällen ist das ‘vollere’ Modell, die ANCOVA ohne-Interaktion, signifikant besser (p < 0.05 jeweils) als die beiden reduzierten ANOVA- und Regressionsmodelle.
- Auch der AIC ist beim volleren Modell am niedrigsten → beide Terme bleiben im Modell.
Automatische Modellselektion

Wir können auch die (automatische) Modellauswahl basierend auf dem AIC mittels step() Funktion durchführen:
Start:  AIC=-249.3
w_ln ~ tl_ln + loc + tl_ln:loc

            Df Sum of Sq    RSS     AIC
- tl_ln:loc  2    0.1011 10.965 -252.27
<none>                   10.864 -249.31

Step:  AIC=-252.27
w_ln ~ tl_ln + loc

        Df Sum of Sq    RSS      AIC
<none>               10.965 -252.267
- loc    2     2.634 13.599 -232.151
- tl_ln  1    34.175 45.140  -95.779
Call:
lm(formula = w_ln ~ tl_ln + loc, data = ChinookArg)

Coefficients:
(Intercept)        tl_ln  locPetrohue   locPuyehue
-8.1217 2.3049 -0.2281 -0.4570 - Zum Schluss wird das ‘optimale’ Modell zusammengefasst.
- Auch hier wird das Modell mit beiden Variablen ohne Interaktion als ‘bestes’ Modell gewählt.
Validierung des finalen Modells

par(mfrow = c(2,3))

# Standardplots
plot(mod_no_interaction, which = c(1,2,4))

# Residuen und gefittete Werte extrahieren
res <- residuals(mod_no_interaction)
fit <- fitted(mod_no_interaction)

# Residuen vs. Location
boxplot(res ~ ChinookArg$loc)

# Gefittete vs. beobachtete Y
plot(x = fit, y = ChinookArg$w_ln)
abline(a = 0, b = 1)
Finales Modell | ANOVA Komponente 1
![]()
Achtung, die Reihenfolge in der Formel zählt!
Analysis of Variance Table

Response: w_ln
           Df Sum Sq Mean Sq F value    Pr(>F)
tl_ln       1 92.083  92.083 906.994 < 2.2e-16 ***
loc         2  2.634   1.317  12.974 8.917e-06 ***
Residuals 108 10.965   0.102
---
Signif. codes: 0 '***' 0.001 '**' 0.01 '*' 0.05 '.' 0.1 ' ' 1Analysis of Variance Table
Response: w_ln
Df Sum Sq Mean Sq F value Pr(>F)
loc 2 60.542 30.271 298.16 < 2.2e-16 ***
tl_ln 1 34.175 34.175 336.61 < 2.2e-16 ***
Residuals 108 10.965 0.102
---
Signif. codes: 0 '***' 0.001 '**' 0.01 '*' 0.05 '.' 0.1 ' ' 1- In R wirkt sich die Reihenfolge, in der die Variablen in die Formel eingeben werden, auf die ANOVA-Ergebnistabelle aus (einschließlich p-Werte), wenn das Design unausgewogen ist.
aov()undanova()erzeugen “sequentielle” Quadratsummen (“Typ-I-Quadratsummen”), während sie gleichzeitig die Hierarchie beachten.- Hierarchie bedeutet, dass der Achsenabschnitt zuerst vor allen anderen Termen angepasst wird, die Haupteffekte als nächstes und die Wechselwirkungen immer als letztes.
- Die meisten anderen Statistikpakete verwenden stattdessen die marginale Anpassung von Termen (“Typ III Summe der Quadrate”). In diesem Fall spielt die Reihenfolge des Auftretens der Terme in der Formel keine Rolle, ebenso wenig wie die Hierarchie.
- Die erste Anordnung ergibt die Summenquadrate für loc “ohne” tl_ln und für tl_ln “nach” loc.
- Die zweite ergibt die Summenquadrate für tl_ln “ohne” loc und für loc “nach” tl_ln.
Finales Modell | ANOVA Komponente 2

- Lösung 1: Den Faktor ans Ende der Formel stellen (wenn es nur einen gibt) → wie in
mod_no_interaction - Lösung 2: Den p-Wert aus der
drop1(model, test = "F")Funktion entnehmen:
Single term deletions

Model:
w_ln ~ tl_ln + loc
       Df Sum of Sq    RSS      AIC F value    Pr(>F)
<none>              10.965 -252.267
tl_ln   1    34.175 45.140  -95.779 336.615 < 2.2e-16 ***
loc     2     2.634 13.599 -232.151  12.974 8.917e-06 ***
---
Signif. codes:  0 '***' 0.001 '**' 0.01 '*' 0.05 '.' 0.1 ' ' 1
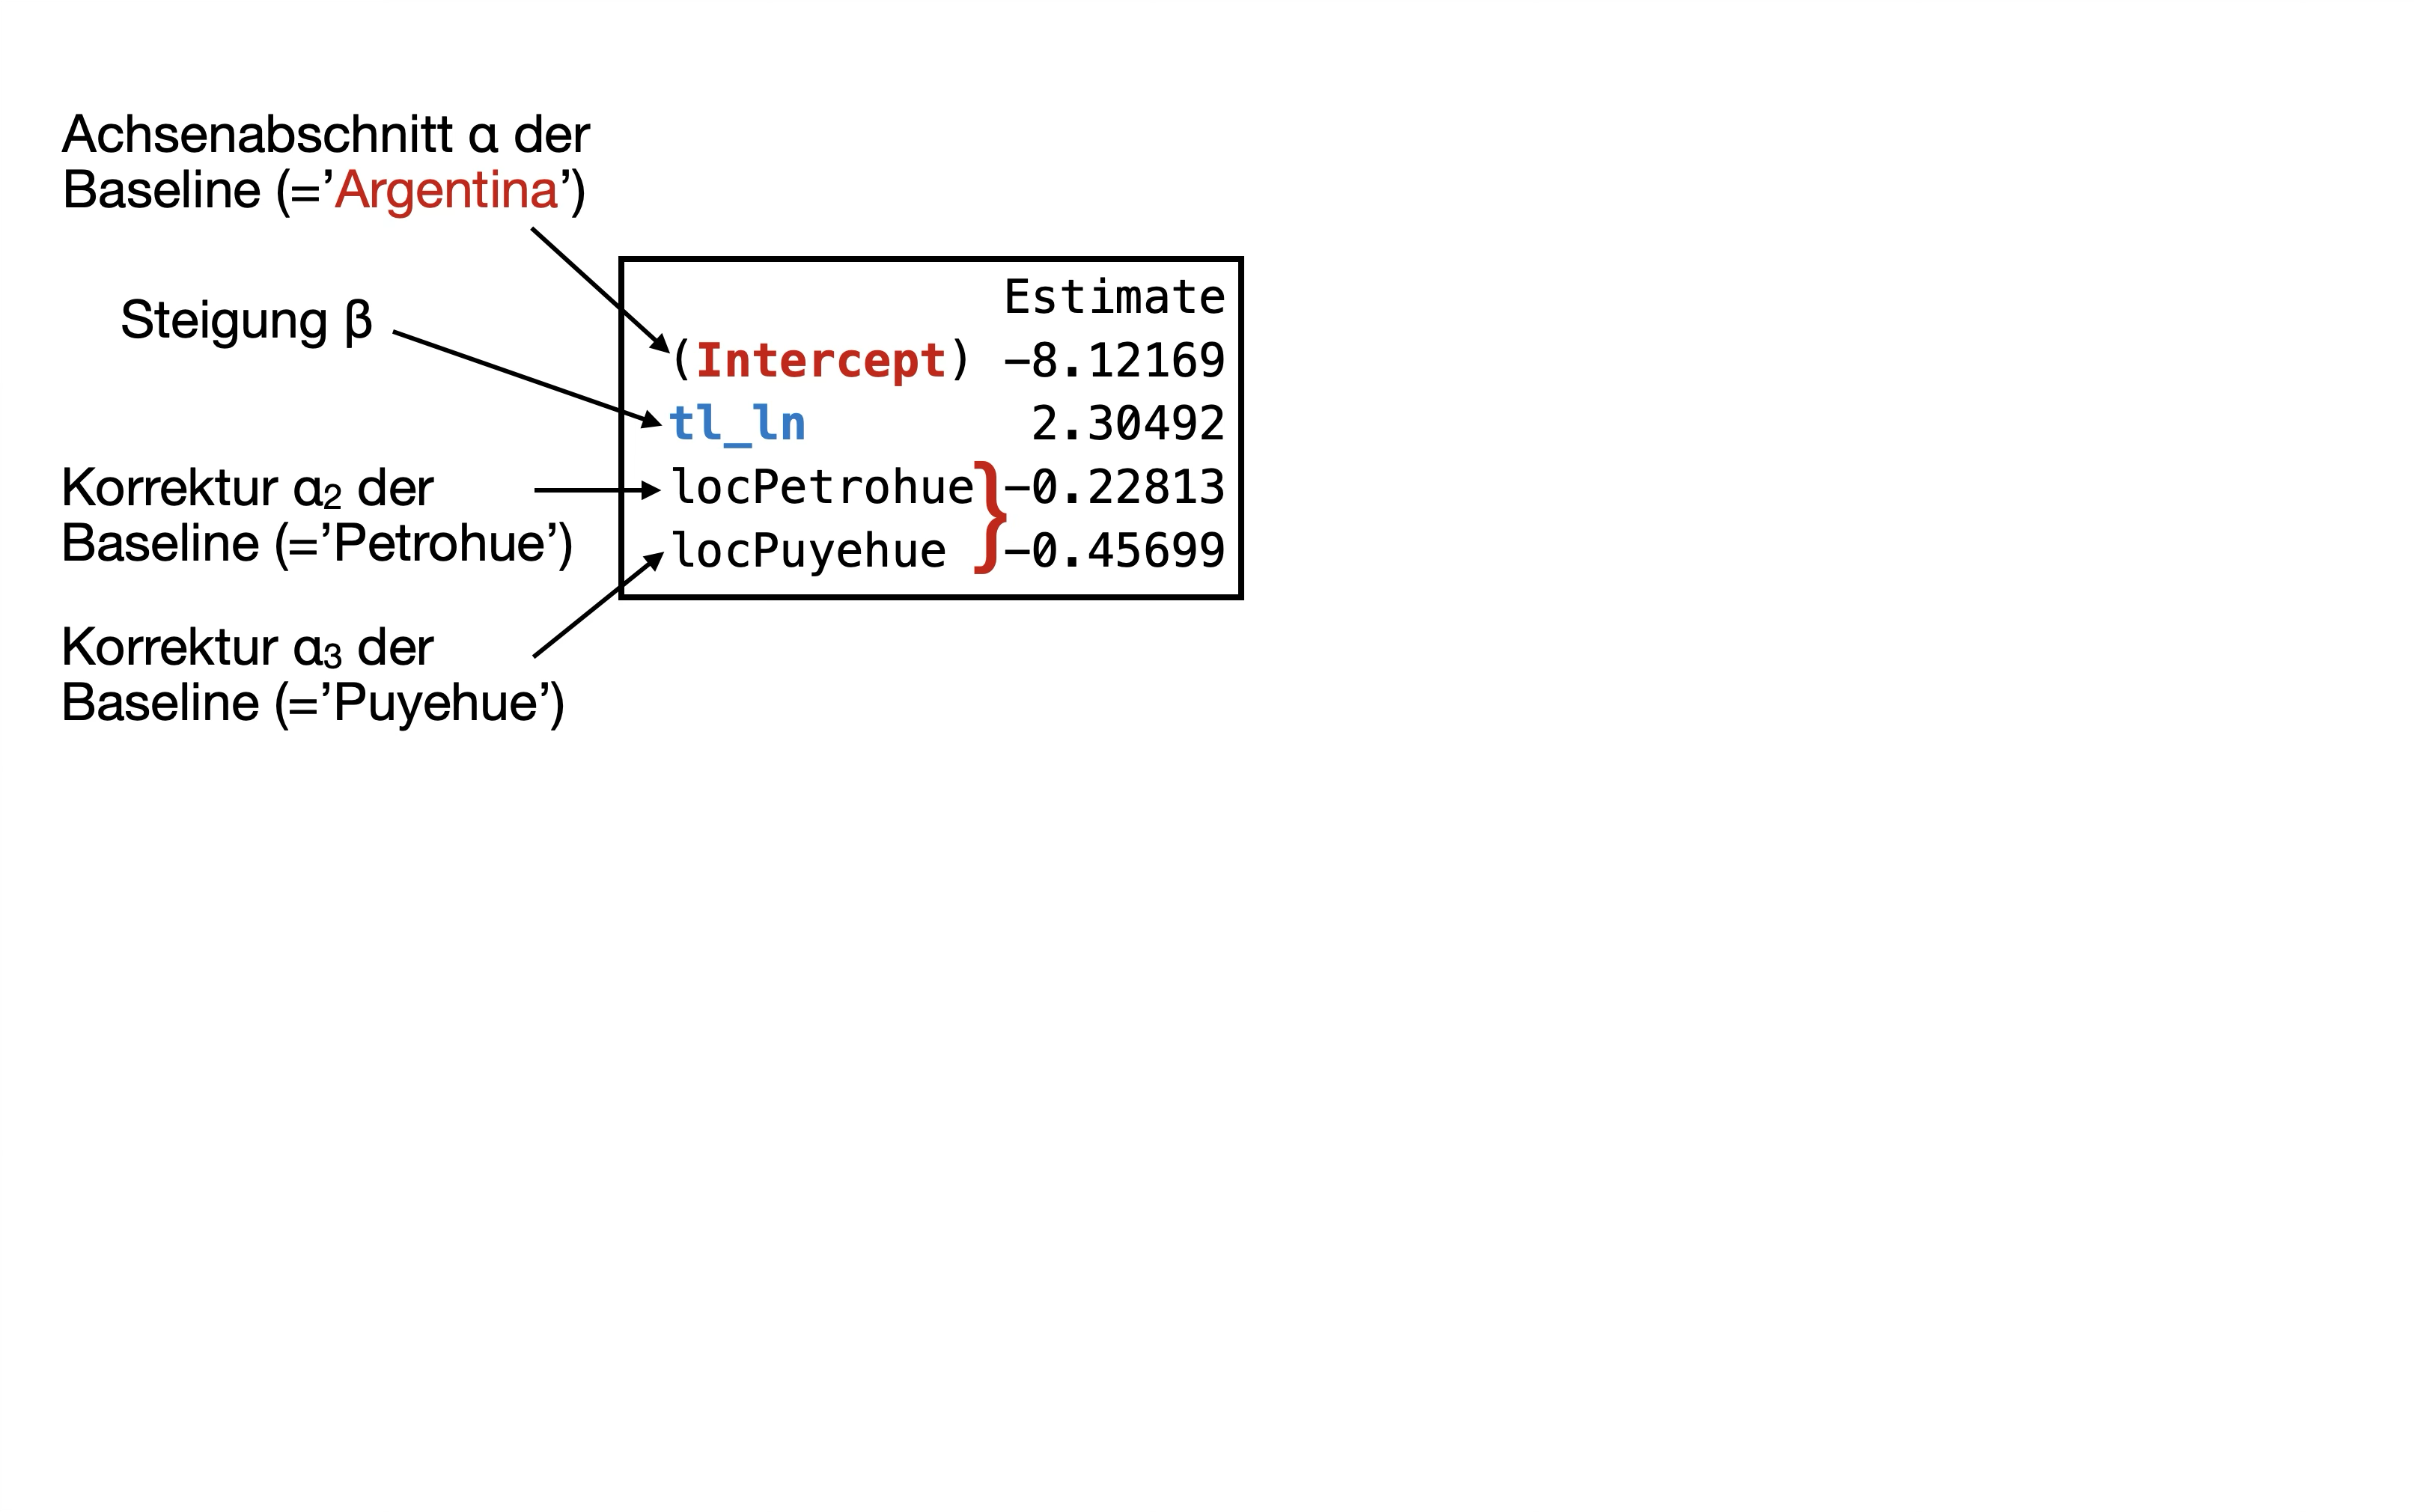
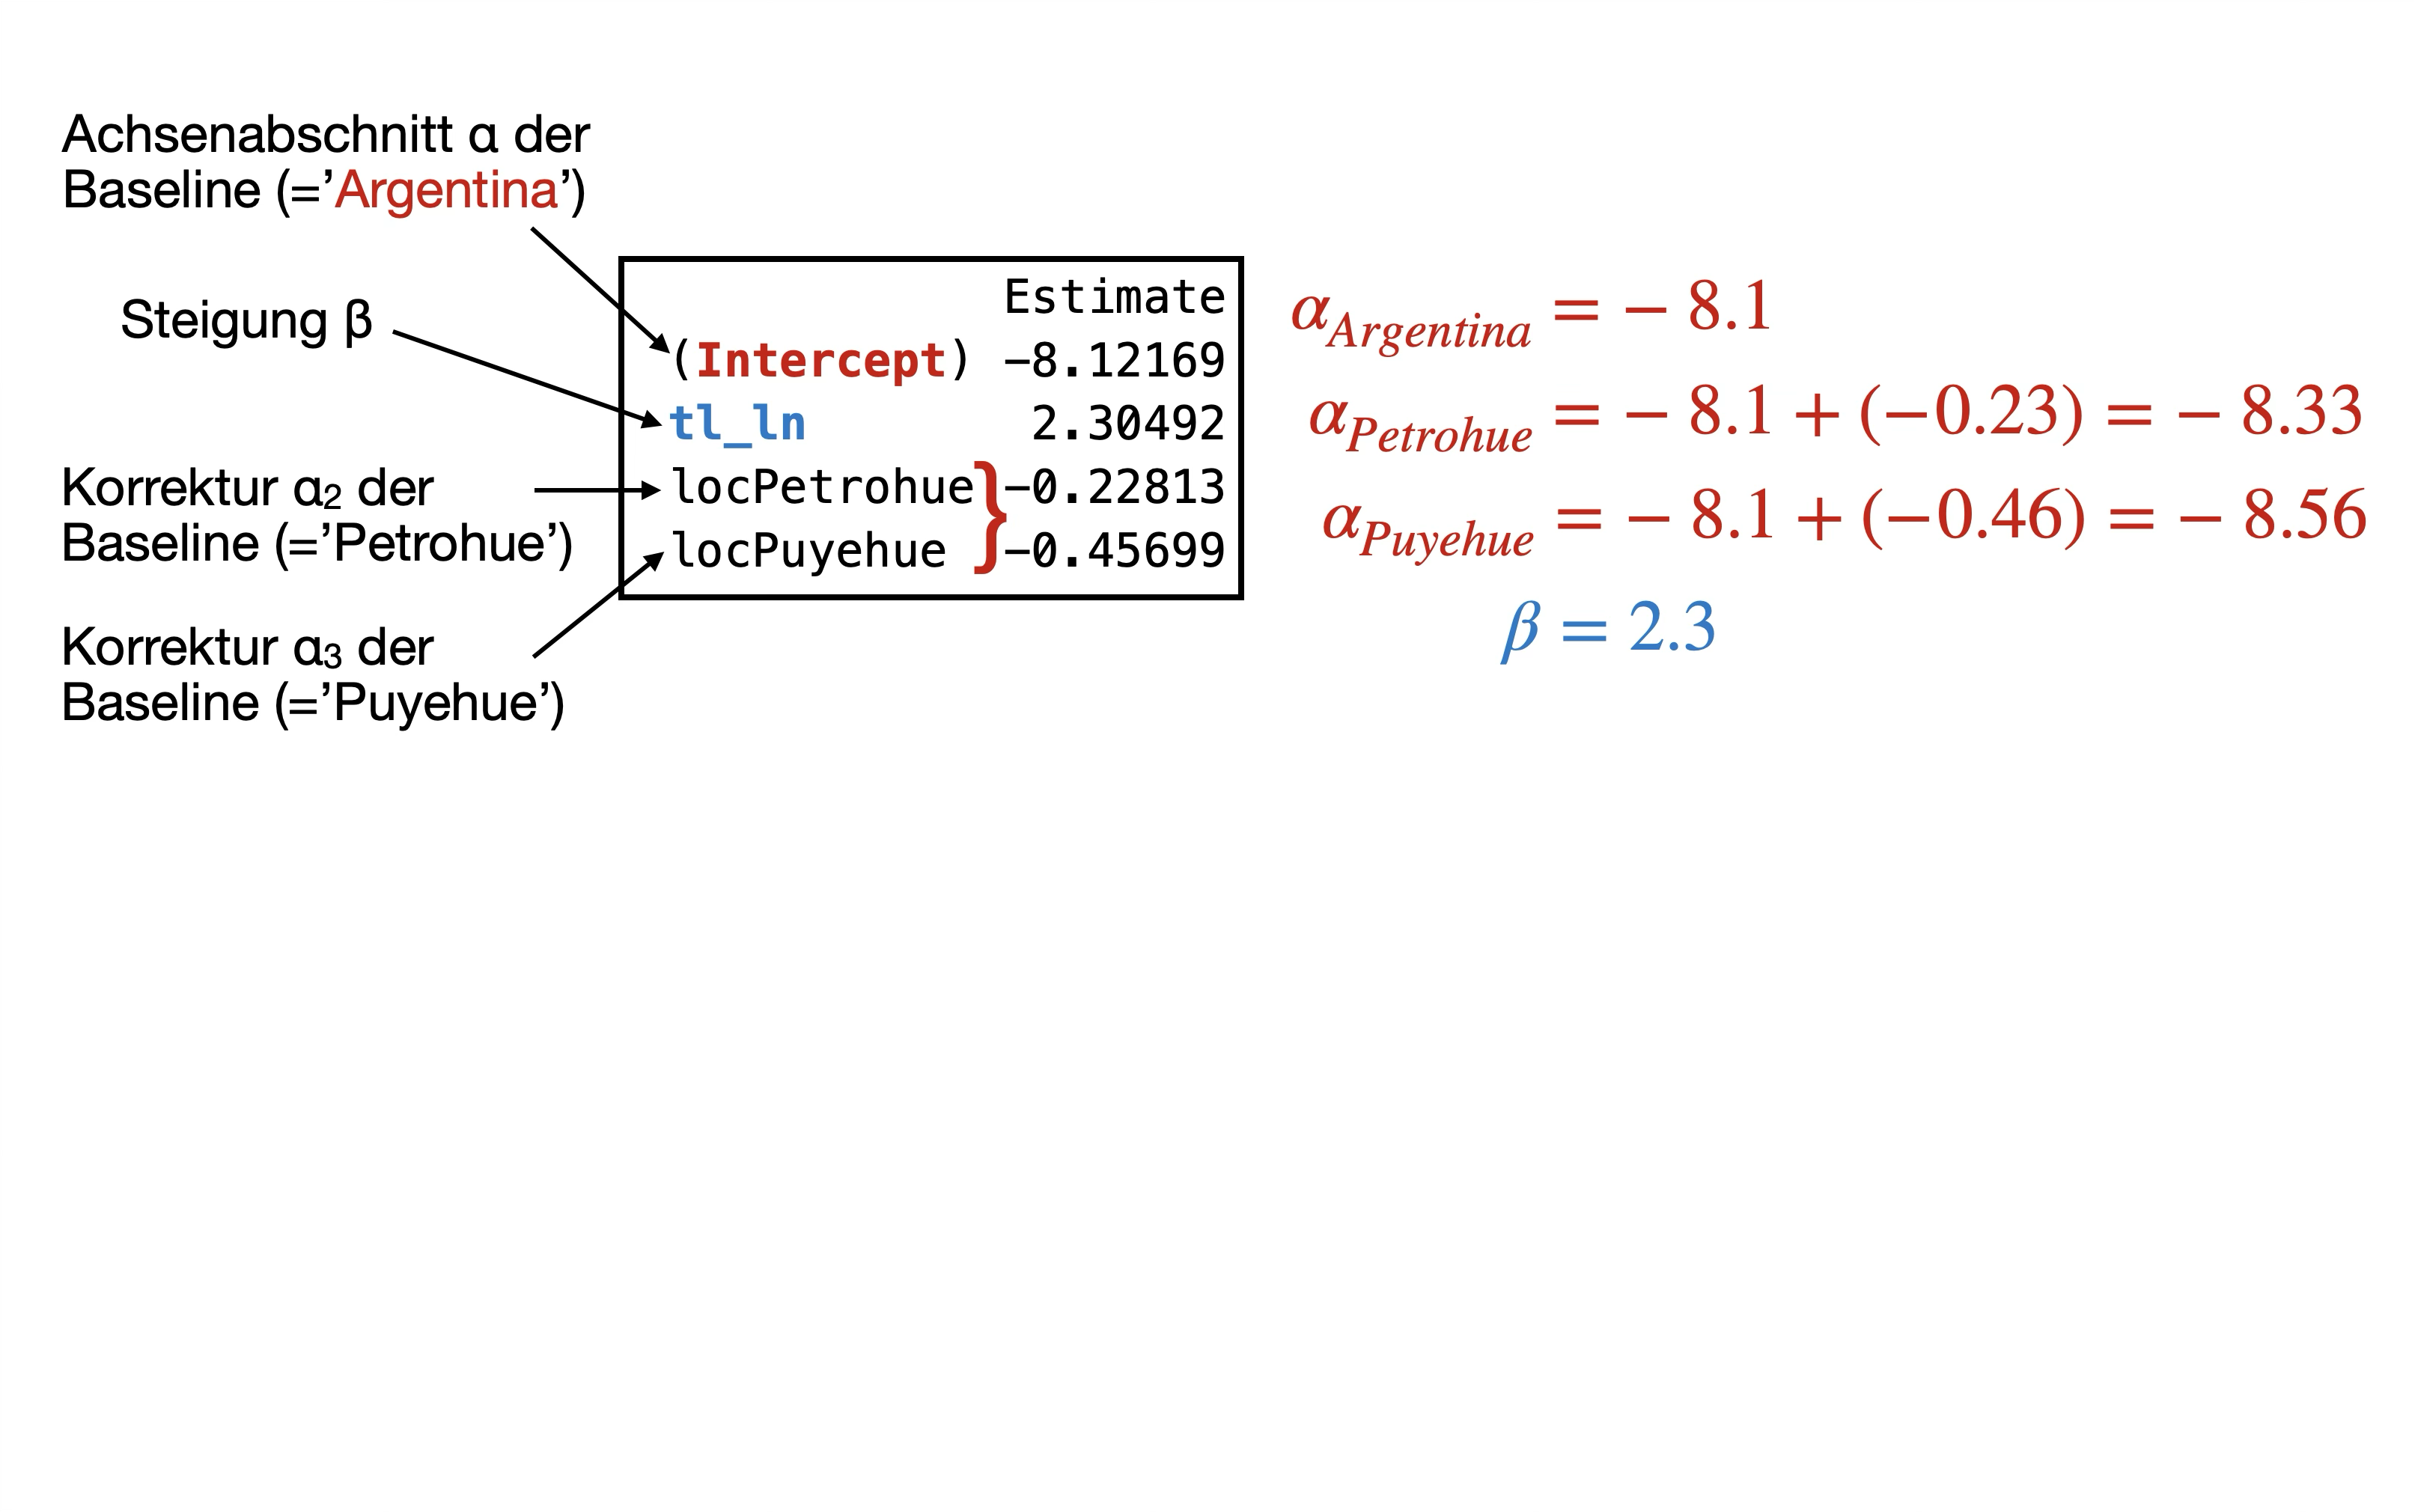
Finales Modell | Regressionsgleichung 1

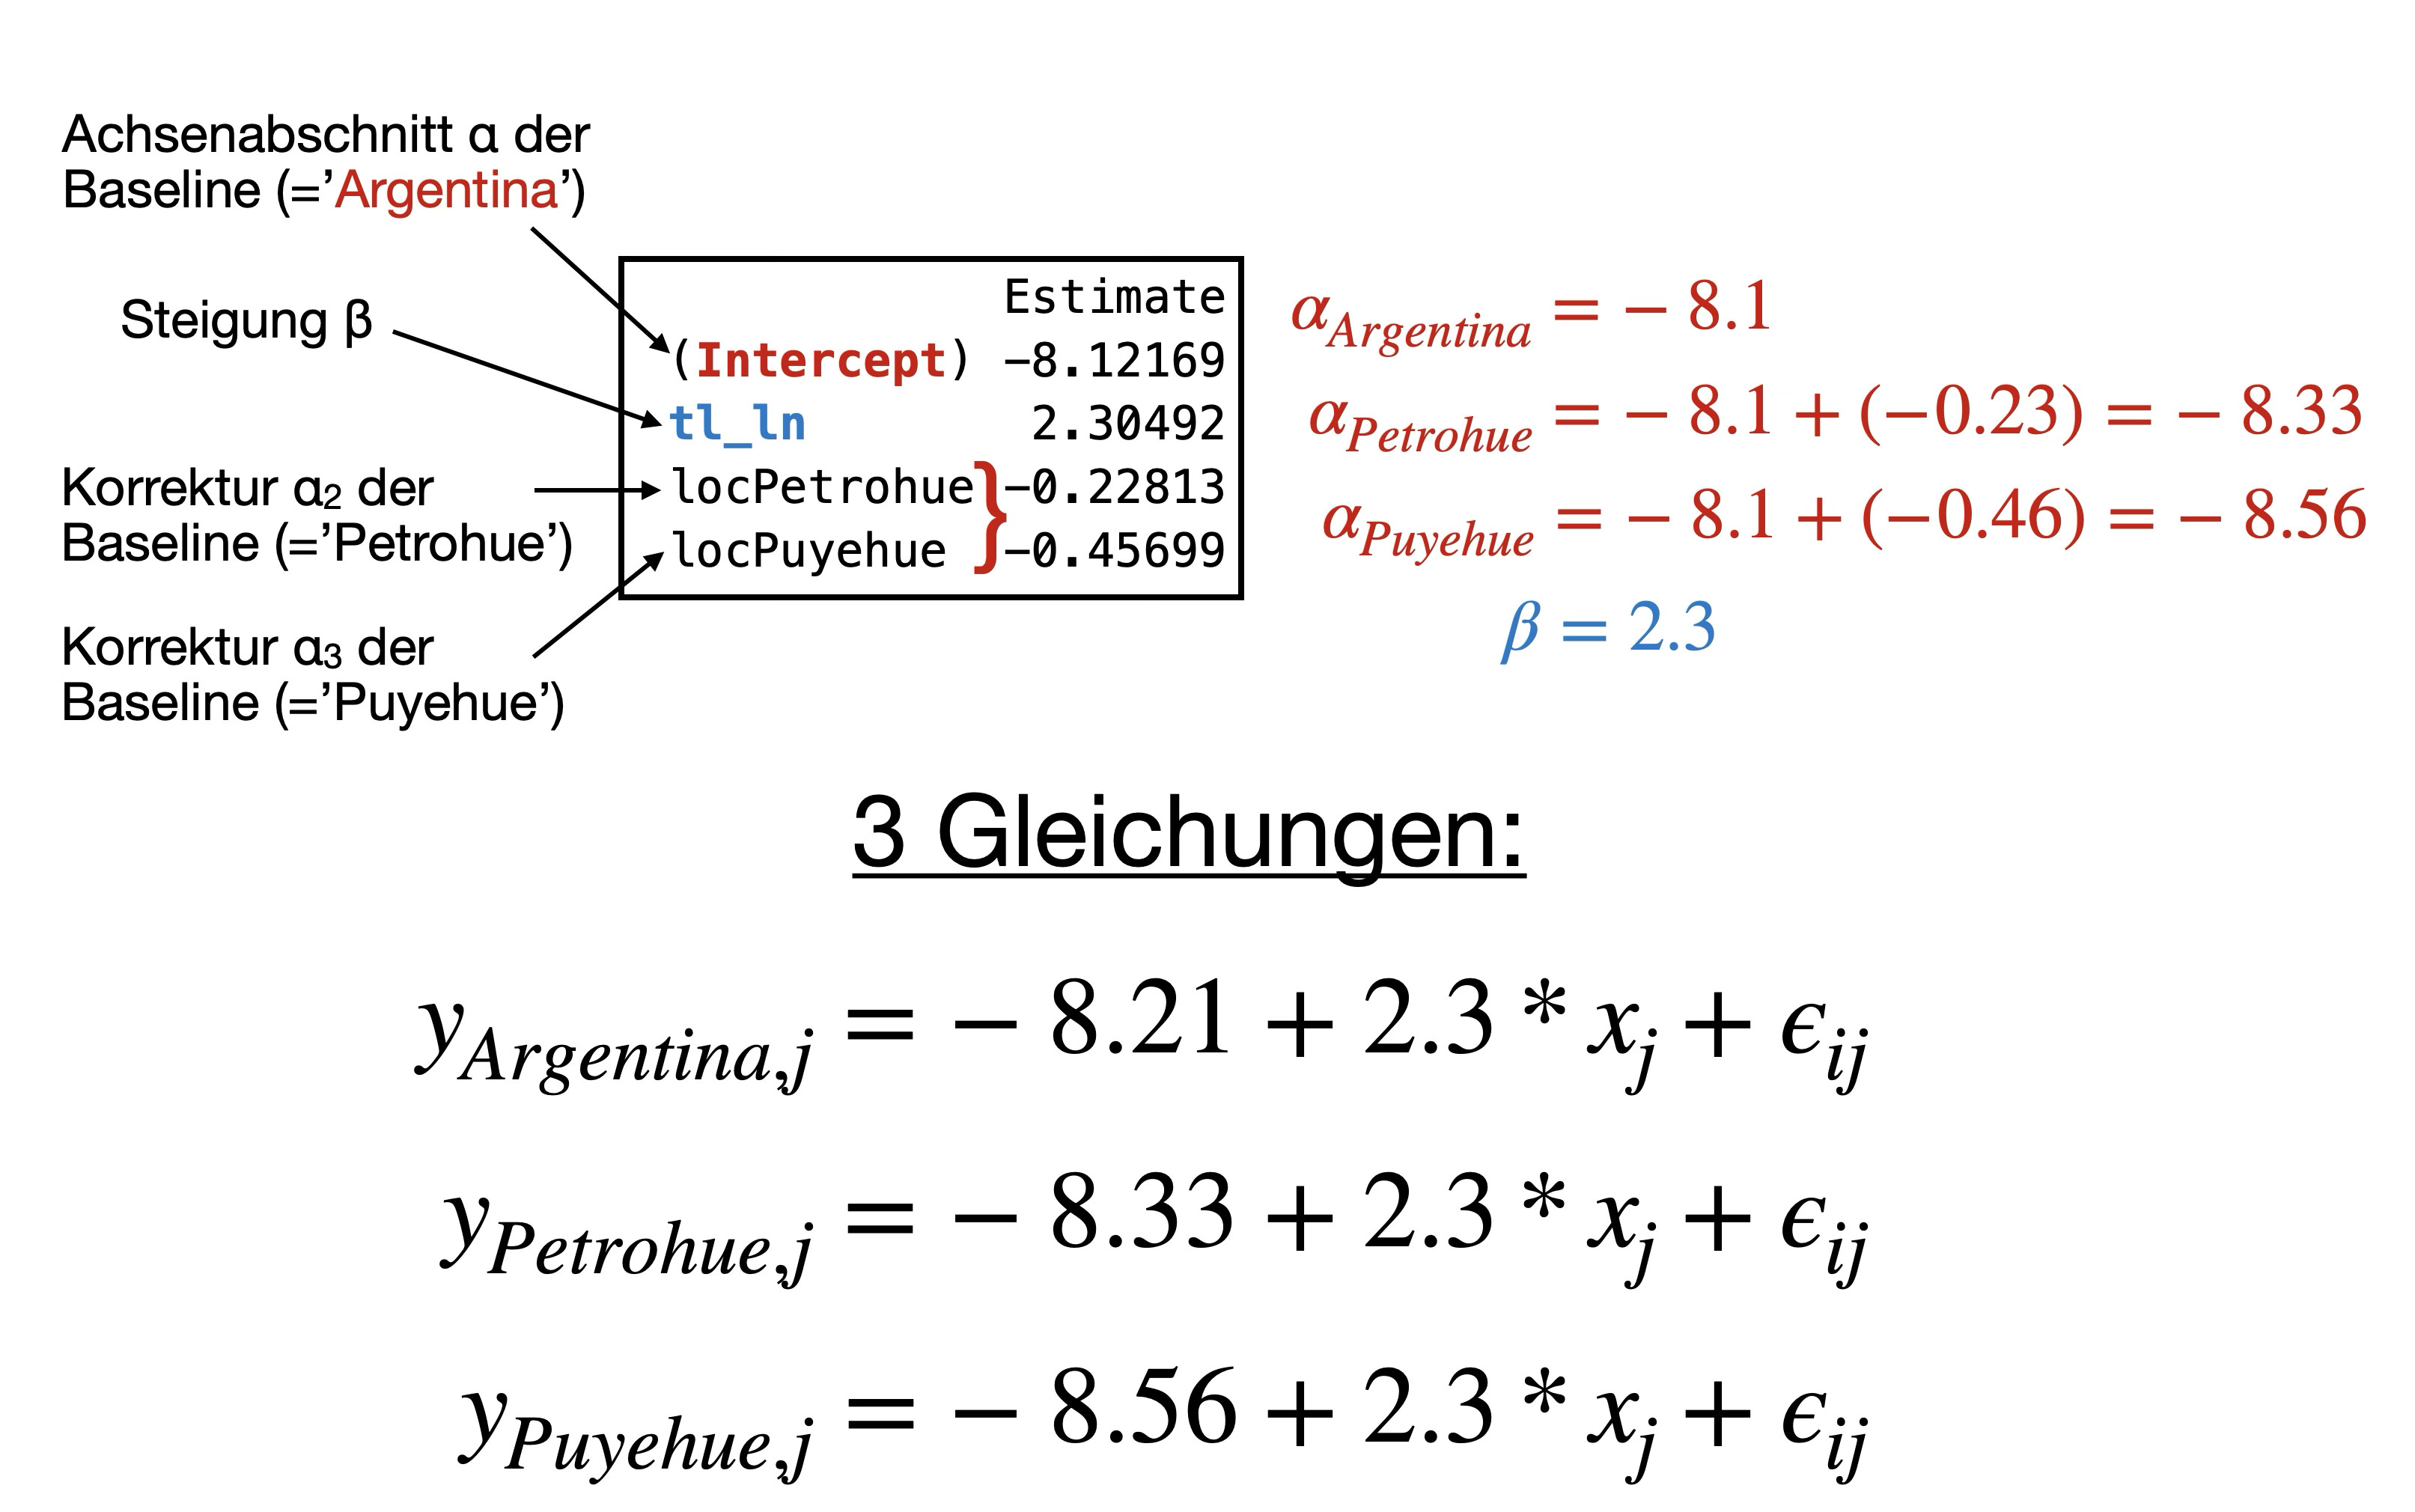
→ Wir haben ein 4-Parameter-Modell: 3 Achsenabschnitte, 1 Steigung
y_{ij}=\alpha_i+\beta*x_j + \epsilon_{ij}
Was sind… ?
- \alpha_{Argentina}, \alpha_{Petrohue}, \alpha_{Puyehue}
- und \beta
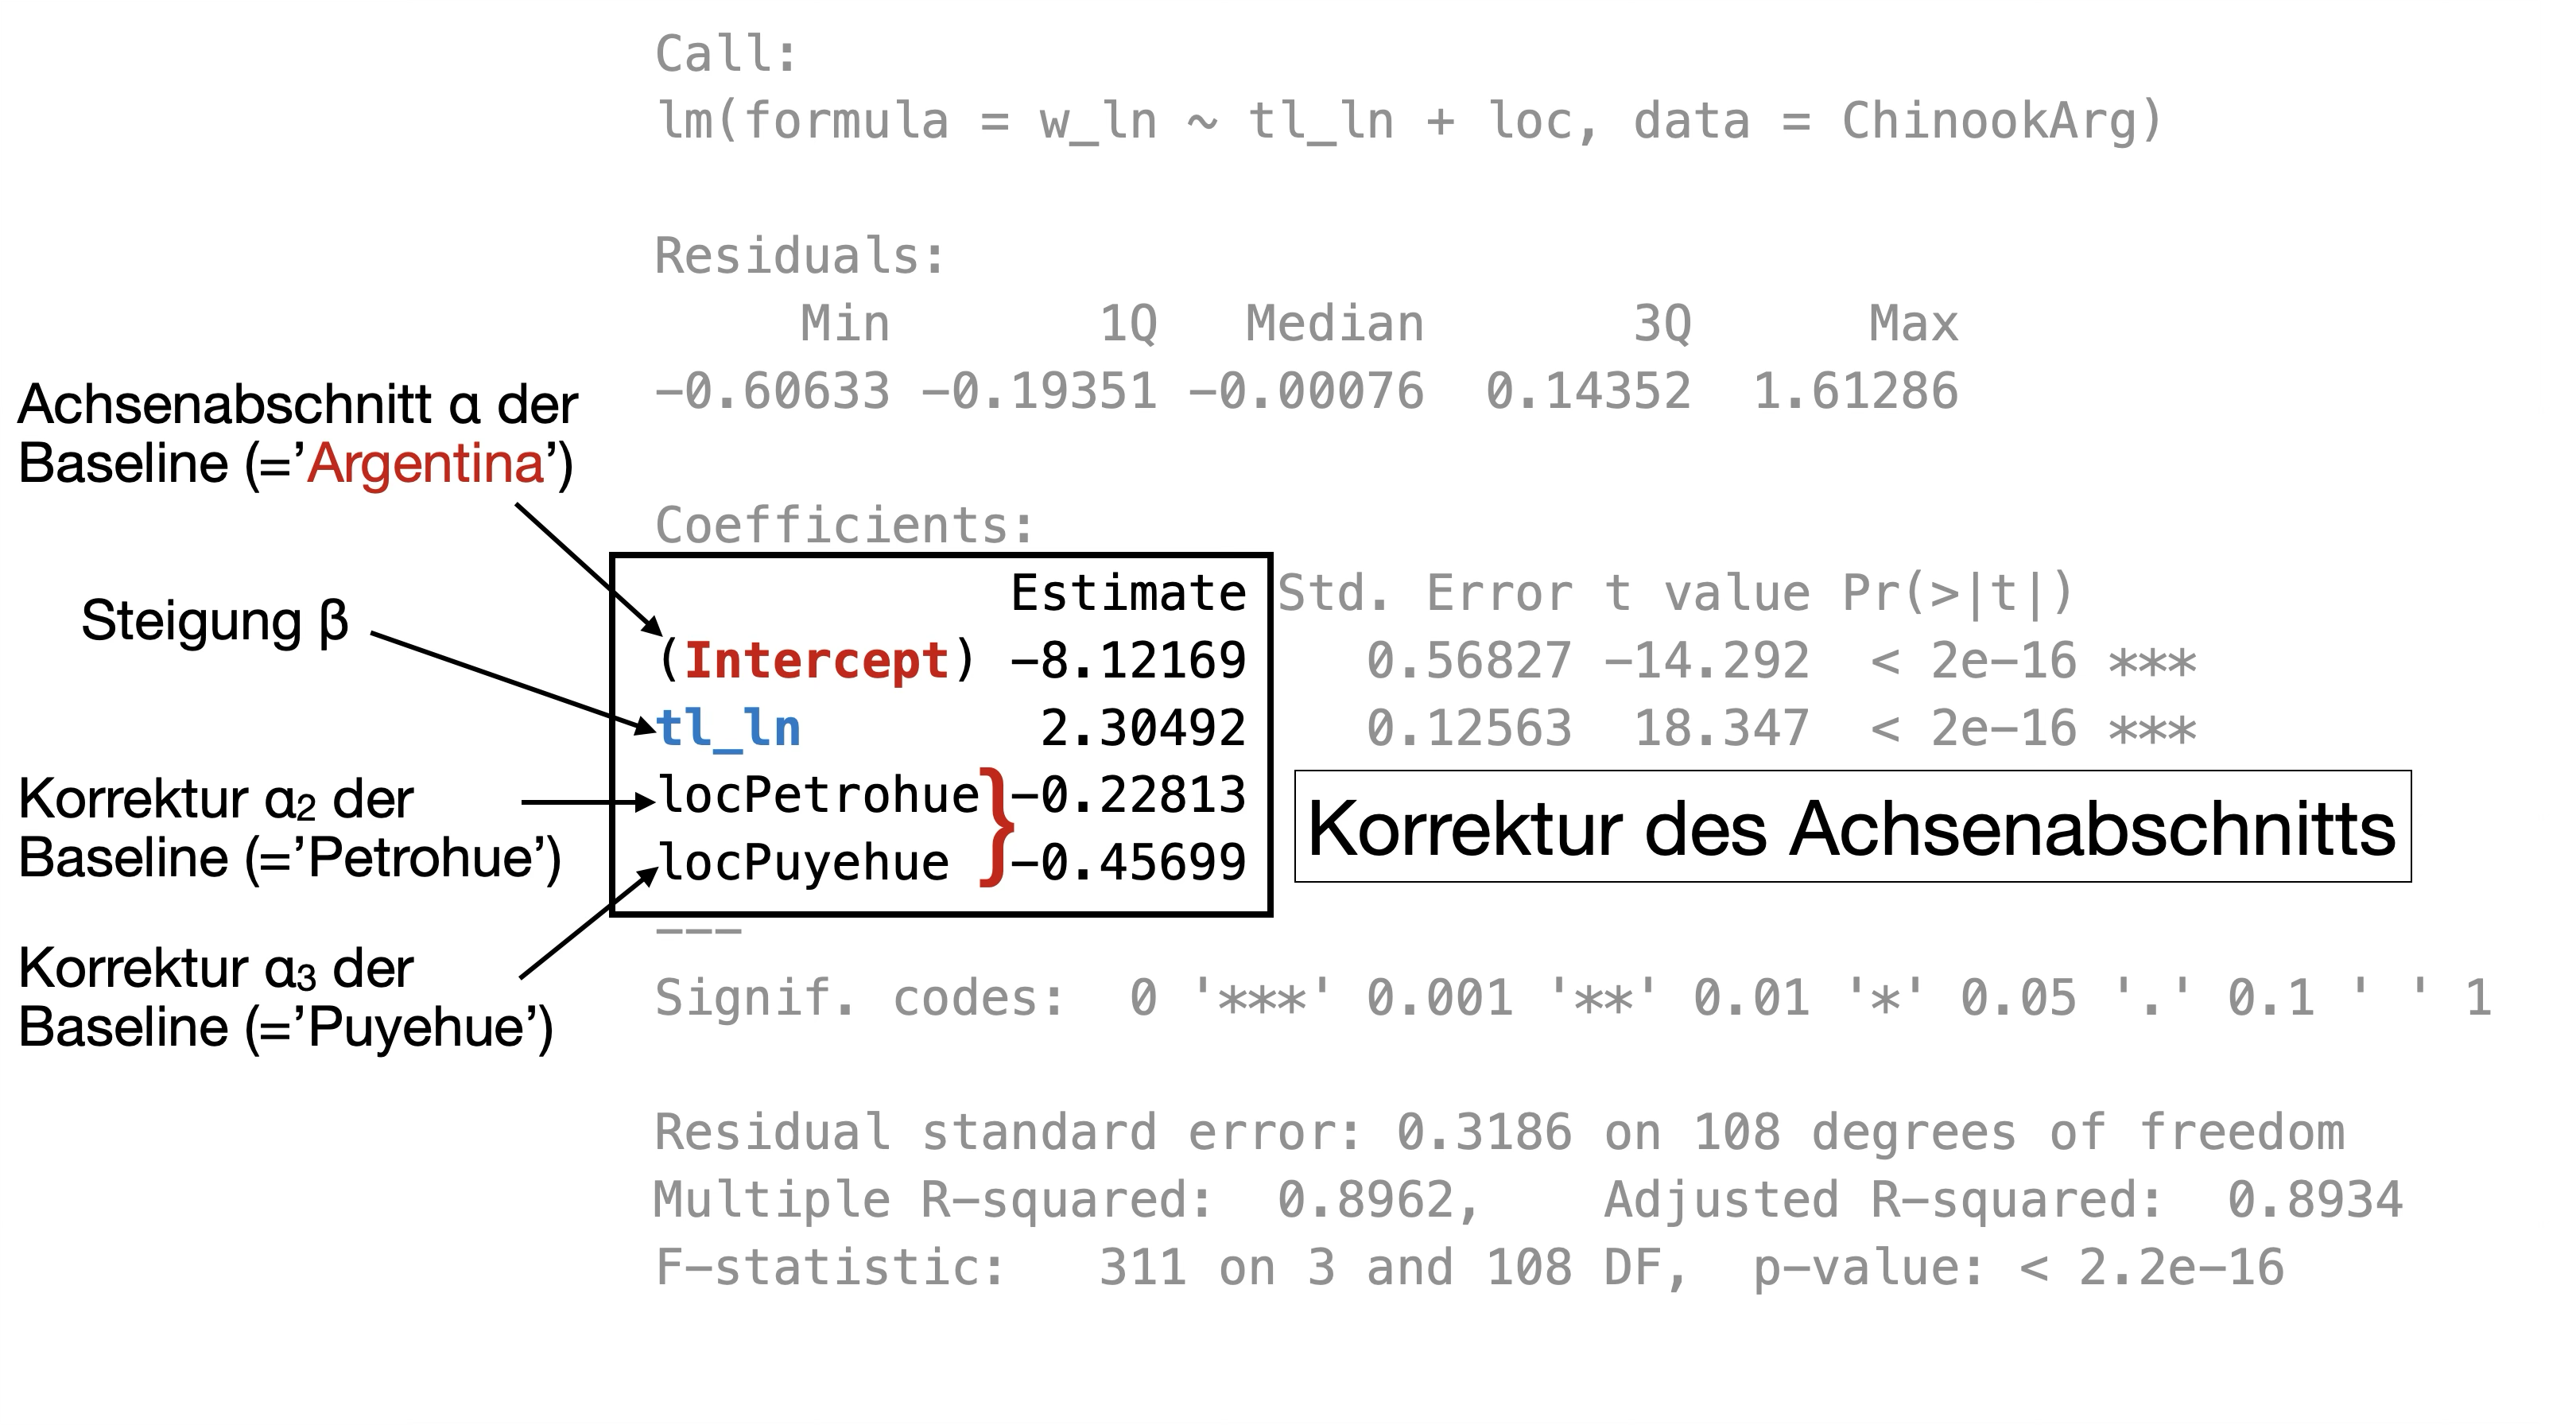
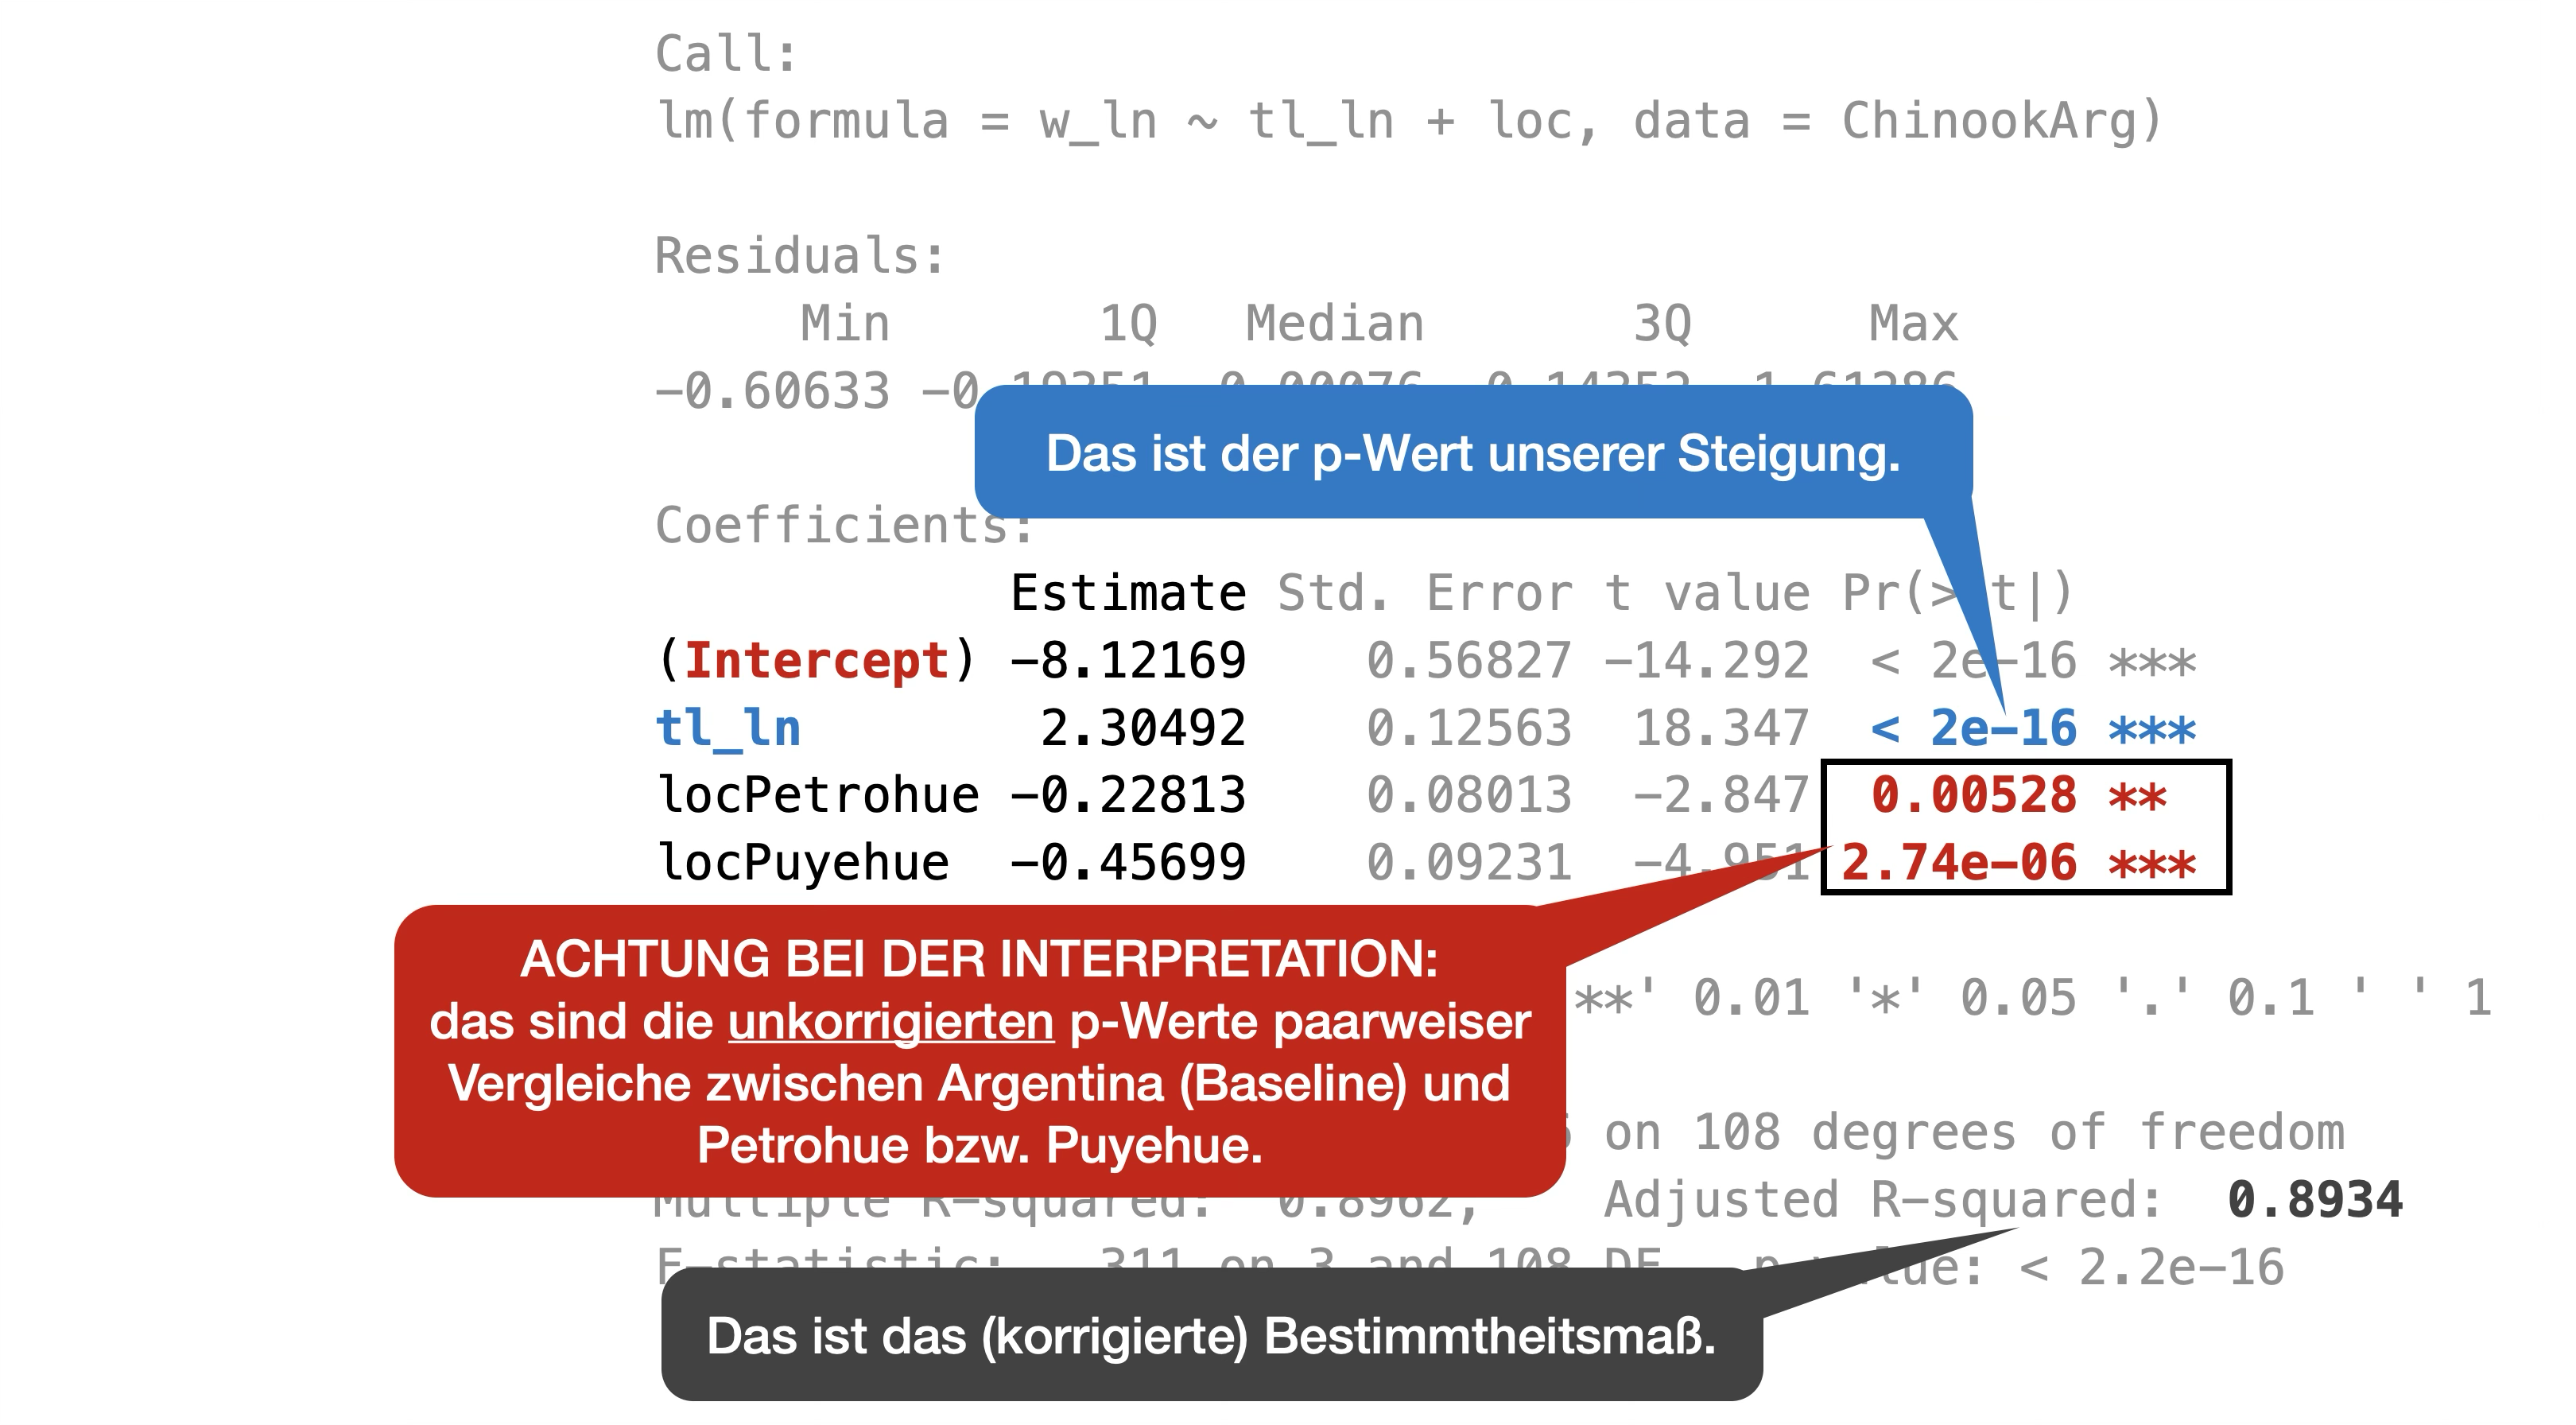
Finales Modell | Summary Output 1

Call:
lm(formula = w_ln ~ tl_ln + loc, data = ChinookArg)

Residuals:
     Min       1Q   Median       3Q      Max
-0.60633 -0.19351 -0.00076  0.14352  1.61286

Coefficients:
            Estimate Std. Error t value Pr(>|t|)
(Intercept) -8.12169    0.56827 -14.292  < 2e-16 ***
tl_ln        2.30492    0.12563  18.347  < 2e-16 ***
locPetrohue -0.22813    0.08013  -2.847  0.00528 **
locPuyehue  -0.45699    0.09231  -4.951 2.74e-06 ***
---
Signif. codes:  0 '***' 0.001 '**' 0.01 '*' 0.05 '.' 0.1 ' ' 1

Residual standard error: 0.3186 on 108 degrees of freedom
Multiple R-squared:  0.8962,    Adjusted R-squared:  0.8934
F-statistic: 311 on 3 and 108 DF, p-value: < 2.2e-16![]()
Finales Modell | Summary Output 2

Finales Modell | Regressionsgleichung 2

Dummy-Variablen - Ein kleiner Exkurs..
- R behandelt kategoriale Variablen in einem linearen Modell wie metrische Variablen.
- In diesem Fall macht das Model y = a + b1*f + b2*x aber wenig Sinn, da b nicht mit f (Faktor) multipliziert werden kann.
- Aber R hat eine Hilfskonstruktion:
- Die einzelnen Stufen des Faktors werden in sog. Dummy-Variablen jeweils konvertiert.
- Jede Dummy-Variable ist als 0 (FALSE) oder 1 (TRUE) kodiert.
- Anzahl der Dummy-Variablen = Anzahl der Gruppen minus 1.
- Alle linearen Modelle passen Faktoren mit Hilfe von Dummy-Variablen an.
Dummy-Variablen | Eine Demonstration
Die Daten
Dummy-Variablen | Eine Demonstration
Die Daten
Dummy-Variablen | Beispiel Königslachse
    (Intercept) locPetrohue locPuyehue  orig_loc
1             1           0          0 Argentina
2             1           0          0 Argentina
3             1           0          0 Argentina
4             1           0          0 Argentina
5             1           0          0 Argentina
6             1           0          0 Argentina
7             1           0          0 Argentina
8             1           0          0 Argentina
9             1           0          0 Argentina
10            1           0          0 Argentina
11            1           0          0 Argentina
12            1           0          0 Argentina
13            1           0          0 Argentina
14            1           0          0 Argentina
15            1           0          0 Argentina
16            1           0          0 Argentina
17            1           0          0 Argentina
18            1           0          0 Argentina
19            1           0          0 Argentina
20            1           0          0 Argentina
21            1           0          0 Argentina
22            1           0          0 Argentina
23            1           0          0 Argentina
24            1           0          0 Argentina
25            1           0          0 Argentina
26            1           0          0 Argentina
27            1           0          0 Argentina
28            1           0          0 Argentina
29            1           0          0 Argentina
30            1           0          0 Argentina
31            1           0          0 Argentina
32            1           0          0 Argentina
33            1           0          0 Argentina
34            1           0          0 Argentina
35            1           1          0  Petrohue
36            1           1          0  Petrohue
37            1           1          0  Petrohue
38            1           1          0  Petrohue
39            1           1          0  Petrohue
40            1           1          0  Petrohue
41            1           1          0  Petrohue
42            1           1          0  Petrohue
43            1           1          0  Petrohue
44            1           1          0  Petrohue
45            1           1          0  Petrohue
46            1           1          0  Petrohue
47            1           1          0  Petrohue
48            1           1          0  Petrohue
49            1           1          0  Petrohue
50            1           1          0  Petrohue
51            1           1          0  Petrohue
52            1           1          0  Petrohue
53            1           1          0  Petrohue
54            1           1          0  Petrohue
55            1           1          0  Petrohue
56            1           1          0  Petrohue
57            1           1          0  Petrohue
58            1           1          0  Petrohue
59            1           1          0  Petrohue
60            1           1          0  Petrohue
61            1           1          0  Petrohue
62            1           1          0  Petrohue
63            1           1          0  Petrohue
64            1           1          0  Petrohue
65            1           0          1   Puyehue
66            1           0          1   Puyehue
67            1           0          1   Puyehue
68            1           0          1   Puyehue
69            1           0          1   Puyehue
70            1           0          1   Puyehue
71            1           0          1   Puyehue
72            1           0          1   Puyehue
73            1           0          1   Puyehue
74            1           0          1   Puyehue
75            1           0          1   Puyehue
76            1           0          1   Puyehue
77            1           0          1   Puyehue
78            1           0          1   Puyehue
79            1           0          1   Puyehue
80            1           0          1   Puyehue
81            1           0          1   Puyehue
82            1           0          1   Puyehue
83            1           0          1   Puyehue
84            1           0          1   Puyehue
85            1           0          1   Puyehue
86            1           0          1   Puyehue
87            1           0          1   Puyehue
88            1           0          1   Puyehue
89            1           0          1   Puyehue
90            1           0          1   Puyehue
91            1           0          1   Puyehue
92            1           0          1   Puyehue
93            1           0          1   Puyehue
94            1           0          1   Puyehue
95            1           0          1   Puyehue
96            1           0          1   Puyehue
97            1           0          1   Puyehue
98            1           0          1   Puyehue
99            1           0          1   Puyehue
100           1           0          1   Puyehue
101           1           0          1   Puyehue
102           1           0          1   Puyehue
103           1           0          1   Puyehue
104           1           0          1   Puyehue
105           1           0          1   Puyehue
106           1           0          1   Puyehue
107           1           0          1   Puyehue
108           1           0          1   Puyehue
109           1           0          1   Puyehue
110           1           0          1   Puyehue
111           1           0          1   Puyehue
112 1 0 1 Puyehue- Die ersten 34 Lachse aus Argentina’ erhalten eine 1 bei ‘(Intercept)’ und jeweils eine 0 bei ‘locPetrohue’ und ‘locPuyehue’.
- Die 30 Lachse aus Petrohue werden zusätzlich bei ‘locPetrohue’ mit 1 kodiert.
- Die 48 Lachse aus Puyehue werden zusätzlich ‘locPuyehue’ mit 1 kodiert.
Interpretation des vollen Modells

R erstellt intern eine neue Gleichung mit den Dummy-Variablen:
\begin{align*} w\_nl_{loc,j} = a + a*loc_{Pet} + a*loc_{Puy} + b*length_j + \\ b*loc_{Pet}*length_j + b*loc_{Puy}*tl\_ln_j \end{align*}
- Argentina: -6.67 + -2.4*0 + -2.07*0 + 1.98*tl_ln + 0.48*0*tl_ln + 0.36*0*tl_ln = -6.67 + 1.98*tl_ln
- Petrohue: -6.67 + -2.4*1 + -2.07*0 + 1.98*tl_ln + 0.48*1*tl_ln + 0.36*0*tl_ln = -9.07 + 2.46*tl_ln
- Puyehue: -6.67 + -2.4*0 + -2.07*1 + 1.98*tl_ln + 0.48*0*tl_ln + 0.36*1*tl_ln = -8.74 + 2.34*tl_ln
Interpretation der verschachtelten ANOVA
Zurück zu unserem Seeigel-Experiment
![]()
Effekte des fixed Faktors (Seeigeldichte)
 (Intercept)  Treatment33  Treatment66 Treatment100
39.20 -20.20 -17.65 -37.90 - → Faktorstufe 0% ist in der intercept versteckt.
- → Bei z.B. Faktorstufe 33% ist eine durchschnittliche Fadenalgenbedeckung von 39.20-20.20 = 19% zu erwarten.
Zurück zum finalen Modell | Vorhersage

Code
# Gefittete Werte vom finalen und Max.modell speichern
ChinookArg$fit <- fitted(mod_no_interaction)
ChinookArg$fit_max <- fitted(mod_max)

# ggplot
ggplot(ChinookArg, aes(x = tl_ln, y = w_ln, colour = loc)) +
  geom_point() +
  scale_colour_manual(values =
      c("forestgreen", "orange1", "deeppink4")) +
  guides(colour = "none") +
  geom_line(aes(x = tl_ln, y = fit), linewidth = 1.1) +
  geom_line(aes(x = tl_ln, y = fit_max), linetype = 2, linewidth = 1.2, alpha = 0.5) +
  geom_smooth(method = "lm", se = FALSE, linetype = 3, linewidth = 1.2, alpha = 0.5) +
  labs(x = "ln(Länge)", y = "ln(Gewicht)",
    subtitle = "Vergleich modellierte Werte: finales Modell (durchgängige Linie) vs. Max.modell (gestrichelt) vs. geom_smooth (gepunktet)")
- Y Werte lassen sich mit der Funktion
fitted()undpredict()berechnen. - Bei der
geom_smooth(method = "lm")Methode basieren die gefitteten Werte offensichtlich auf einer ANCOVA mit Interaktion → daher also nicht immer passend!
Was ist, wenn der Faktor zufällig ist?
Gemischtes Lineares Effektmodell (LME)
→ Wir benutzen wieder die lme() Funktion aus dem Paket ‘nlme’ (oder das neuere Paket ‘lme4’).
Zusammenfassung

Allgemeine lineare Modelle
![]()
- Regressions- und ANOVA/ANCOVA-Modelle
- Der Begriff “allgemein” bedeutet, dass sowohl kategoriale als auch metrische Prädiktoren (X) zulässig sind.
- Y ist eine metrische Variable.
- Annahmen: Normalverteilung für Y und Fehlerterme, Varianzhomogenität und Unabhängigkeit
- Schätzung der Parameter und Anpassung des Modells: Methode der kleinsten Quadrate (OLS) → entspricht der Maximum Likelihood (ML)-Schätzung, wenn die Annahmen zutreffen.
Überblick Formelschreibweisen

aus Crawley (2007)
Überblick Modelltypen
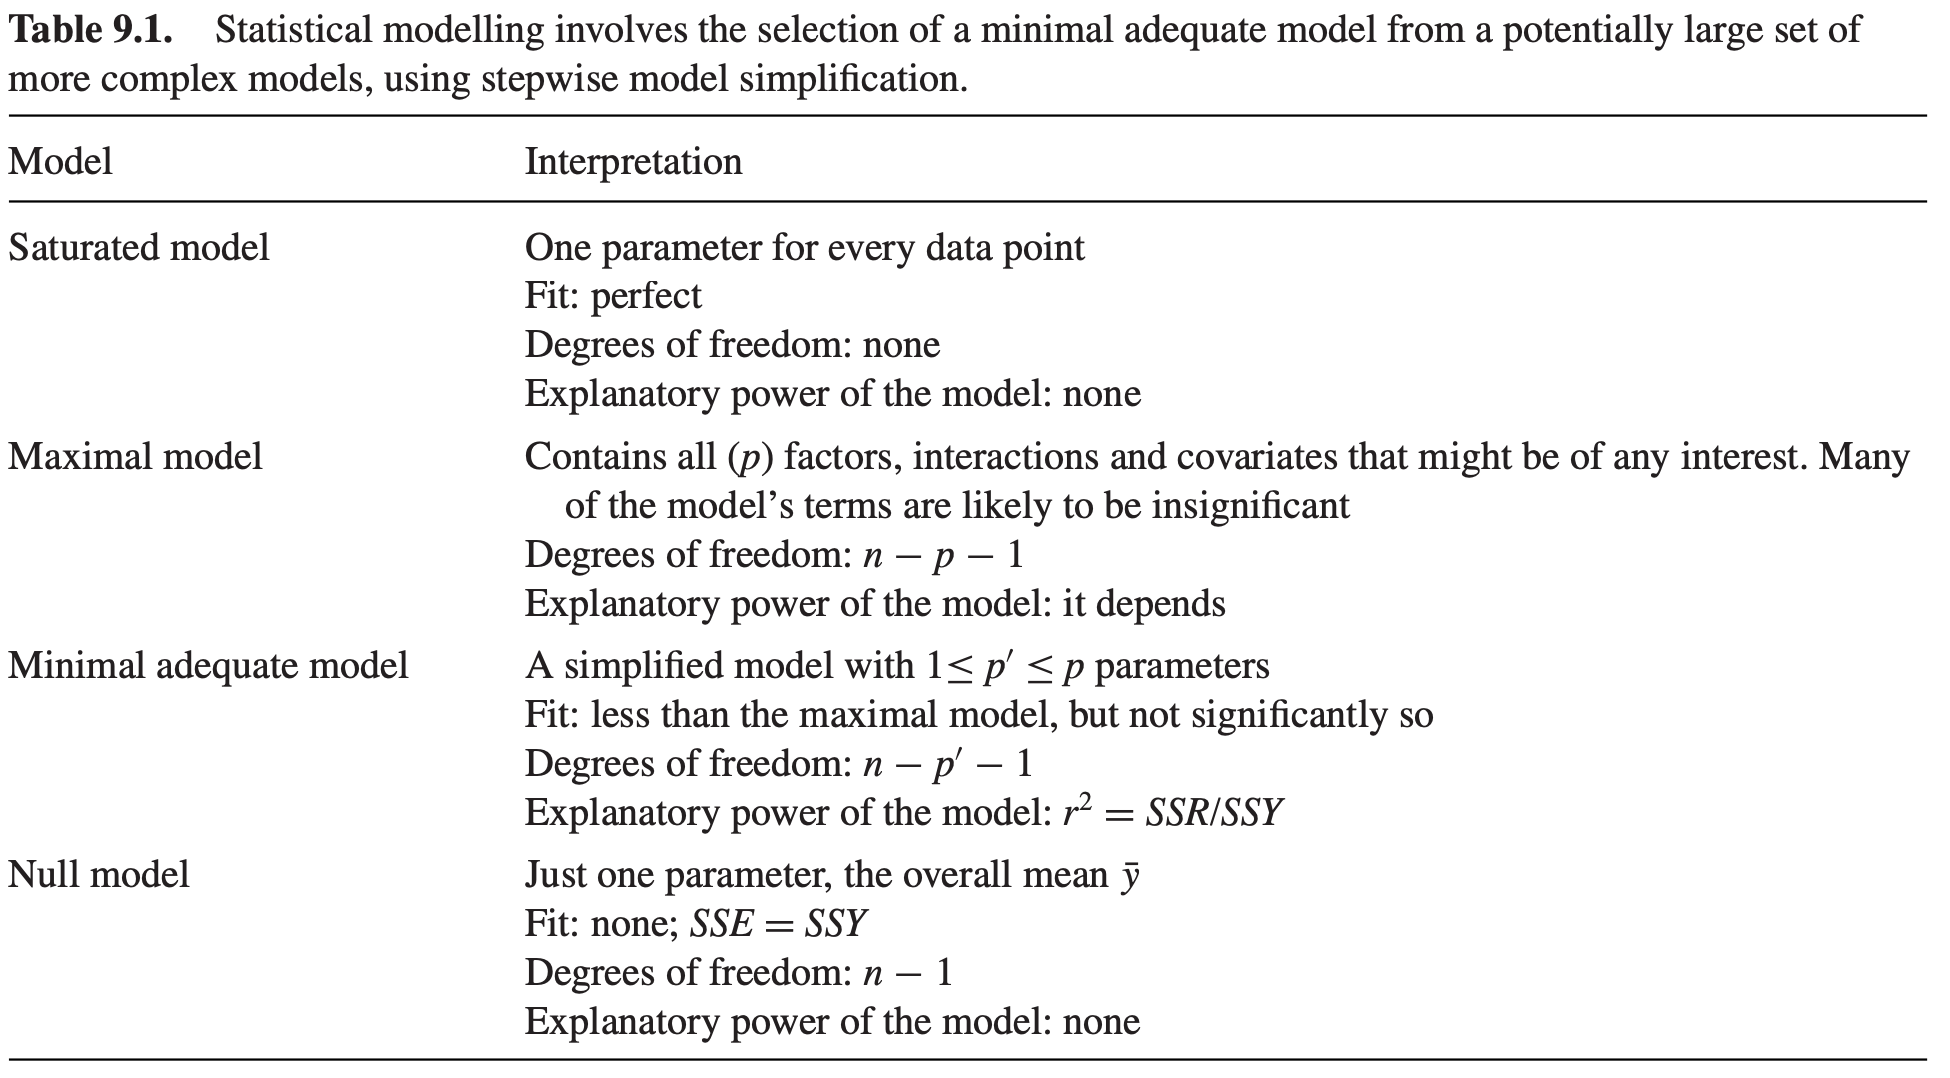
aus Crawley (2013)
Nützliche Funktionen
| Wofür | Funktionen |
|---|---|
| Lin. Regression & ANCOVA | lm() |
| ANOVA | aov() oder anova(lm()) |
| Koeffizienten | coef(mod) |
| Kompletter numerischer Output | summary(mod) |
| Konfidenzintervalle | confint(mod) |
| Vorhersage | predict(mod), modelr::add_predictions(data, mod) |
| Residuen | resid(mod), rstandard(mod), modelr::add_residuals(data, mod) |
| Diagnostikplots | plot(mod) |
| Modellvergleich mit AIC | AIC(mod1, mod2, mod3), step(mod1) |
| Modellvergleich mit F-Statistik | anova(mod1, mod2), drop1(mod1, test = "F") |
Achtung bei der Modellauswahl
Es besteht die Versuchung, sich persönlich an ein bestimmtes Modell zu binden. Statistiker nennen dies “sich in ein Modell verlieben”.
Denken Sie immer daran:
- Alle Modelle sind falsch, aber einige sind nützlich.
- Einige Modelle sind besser als andere.
- Das richtige Modell kann man nie mit Sicherheit wissen.
- Je einfacher das Modell ist, desto besser ist es.
DSB Cheatsheet: Basic Statistics with R

Enthält wichtigste Grundfunktionen zur Statistik und statistischen Modellierung
Download Link (alternativ auch im Moodle-Kurs)
Ablaufprotokoll
![]()

Die Datei ist auf Moodle verfügbar.
Fragen..??

Total konfus?

Buchkapitel zum Nachlesen
- The R Book von M.J. Crawley:
- Kapitel 9 - Statistical Modelling
- Kapitel 12.1 - Analysis of covariance in R
- Experimental Design and Data Analysis for Biologists von G.P. Quinn & M.J. Keough:
- Kapitel 12 Analysis of covariance
Übungsaufgabe

Übung
![]()
- Zuhause (VOR der Übung): Aufgabe im Übungsskript DS3_05_Uebungen_MultipleRegression_ANCOVA.Rmd:
- Größenmessungen bei erwachsenen Pinguinen auf Nahrungssuche in der Nähe der Palmer Station, Antarktis
- Füllen Sie die Lücken im Code und führen Sie eine Modellselektion durch.
- Beantworten Sie die Fragen im Moodle-Quiz zur Aufgabe
- WÄHREND der Übungsstunde:
- Besprechung der Lösung
- Fragenrunde
R Notebook und Datensatz sind im Moodlekurs (Woche 5) zu finden.
Total gelangweilt?

Dann testen Sie doch Ihr Wissen in folgendem Abschlussquiz…
Abschlussquiz
![]()

Bei weiteren Fragen: saskia.otto(at)uni-hamburg.de

Diese Arbeit is lizenziert unter einer Creative Commons Attribution-ShareAlike 4.0 International License mit Ausnahme der entliehenen und mit Quellenangabe versehenen Abbildungen.
Kurswebseite: Data Science 3
