
Code
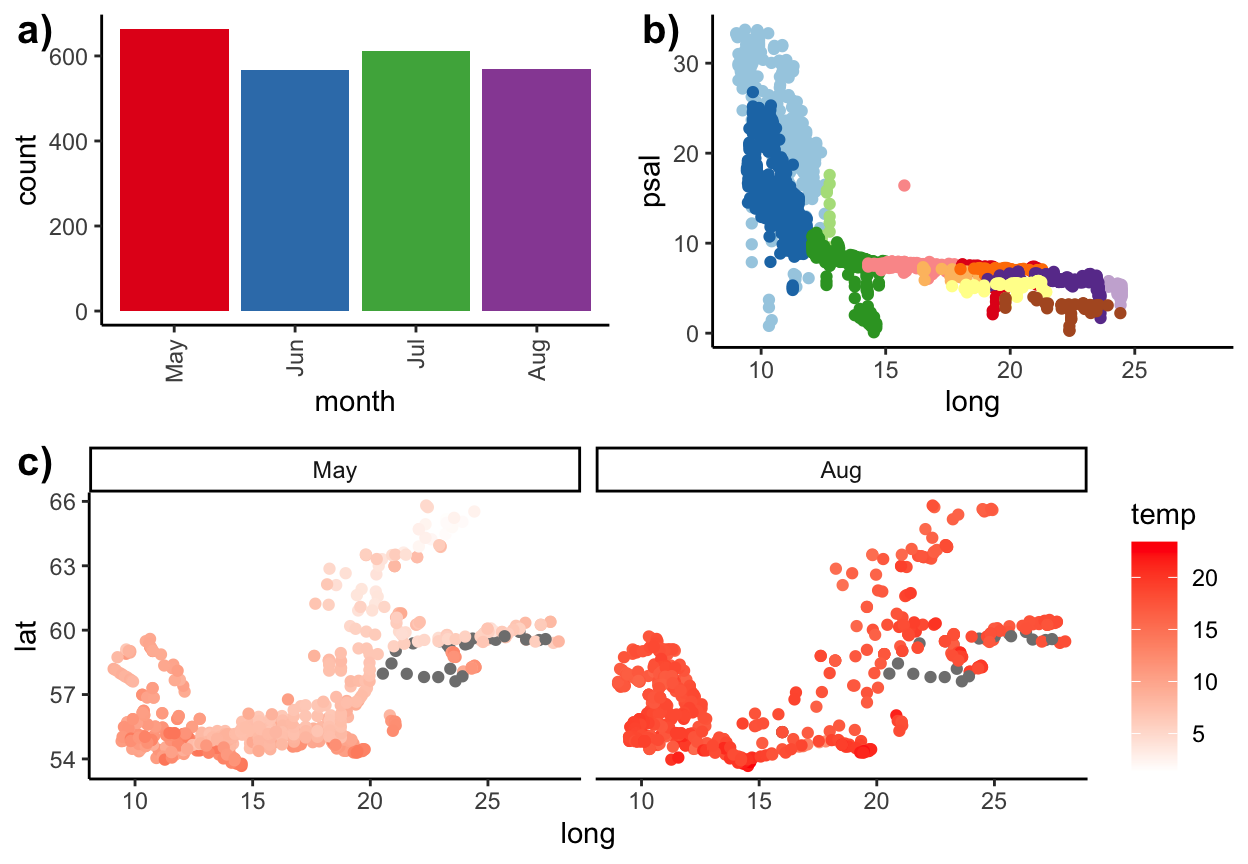
summer <- bshydro15 |>
filter(pres <= 5, month %in% c("May", "Jun", "Jul", "Aug"))
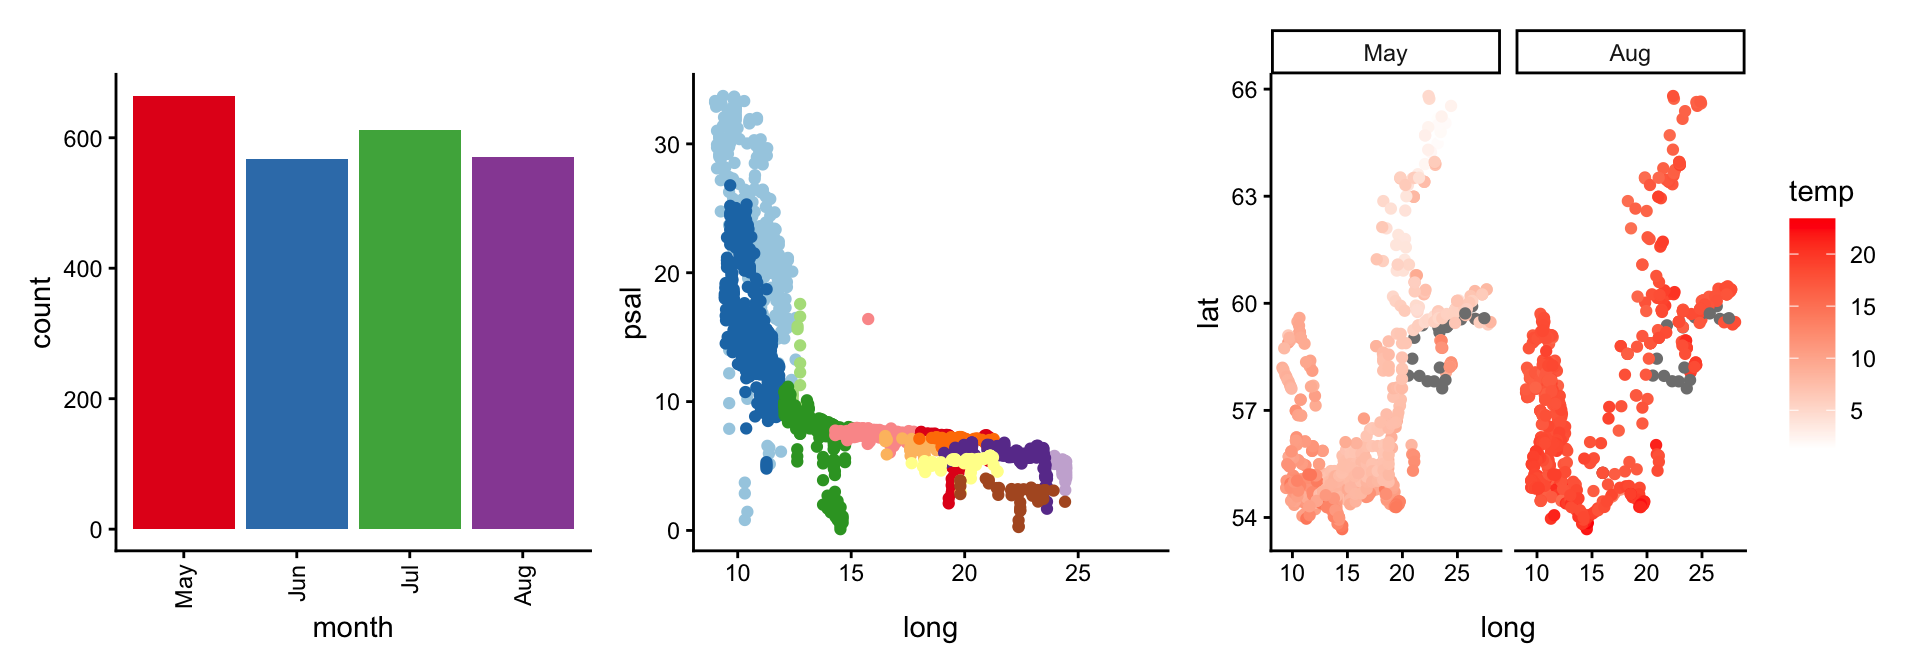
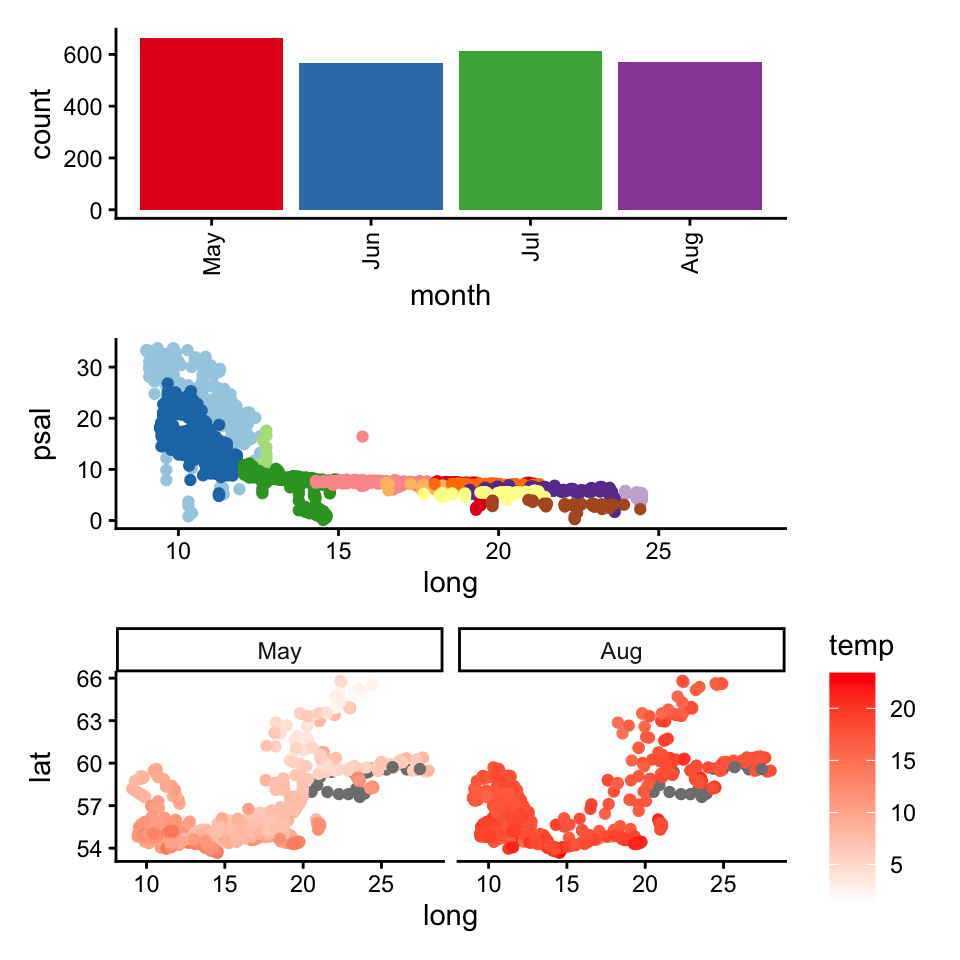
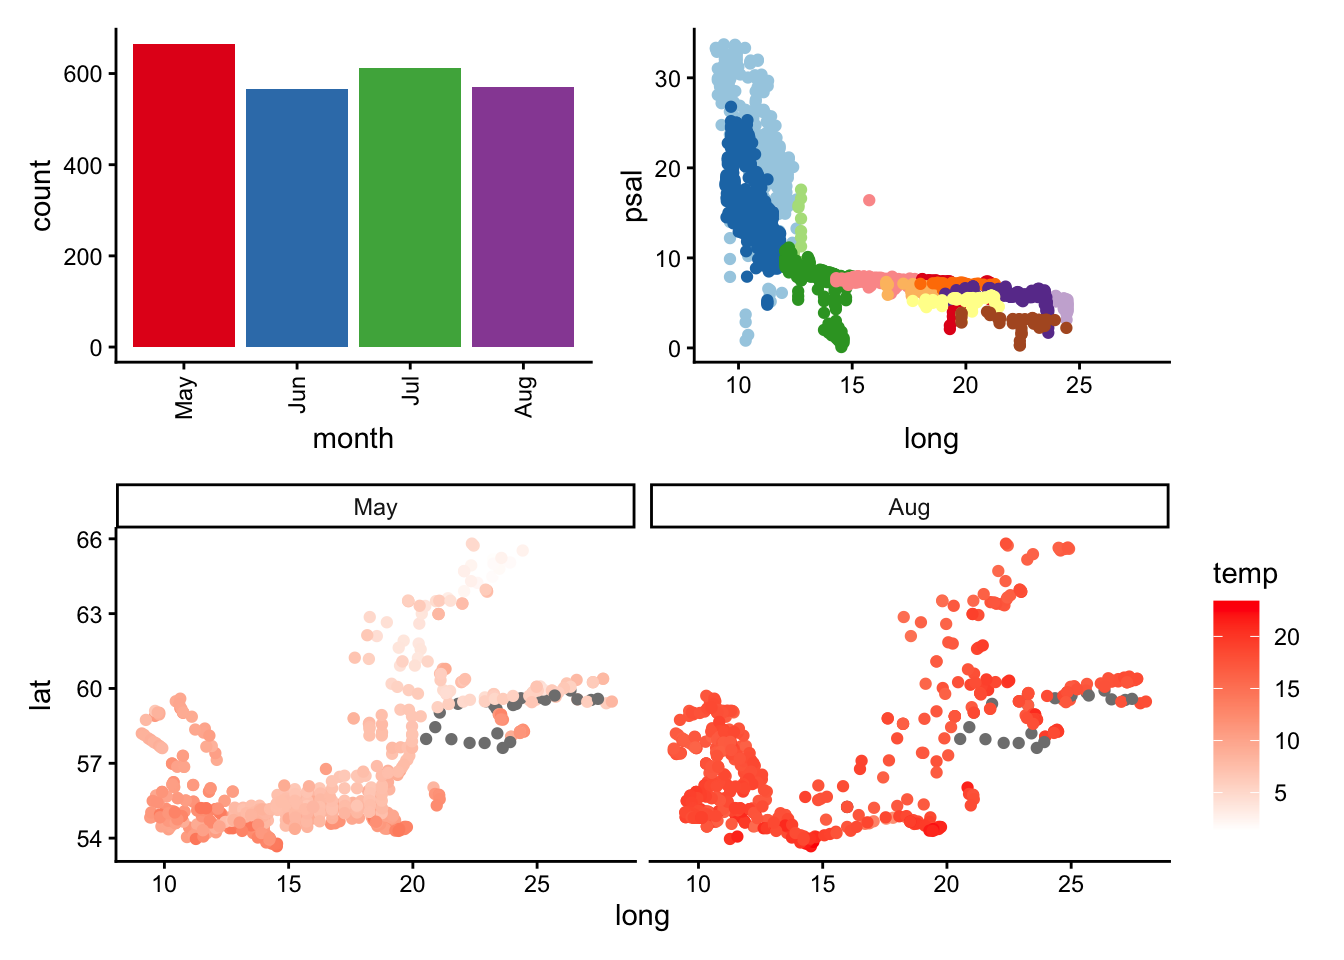
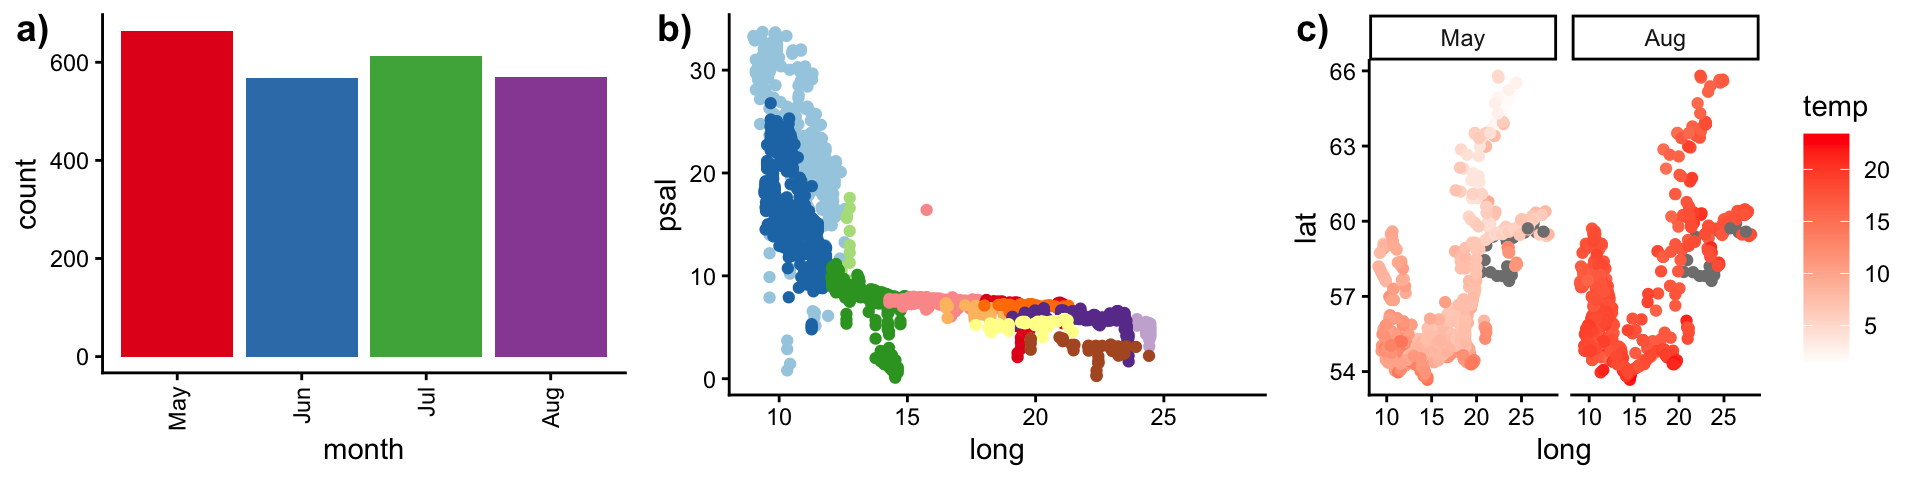
a <- summer |>
select(sampling_id, month) |>
distinct() |>
ggplot(aes(x = month)) +
geom_bar(aes(fill = month)) +
guides(fill = "none") +
scale_fill_brewer(palette = "Set1") +
guides(x = guide_axis(angle = 90)) +
theme_classic()
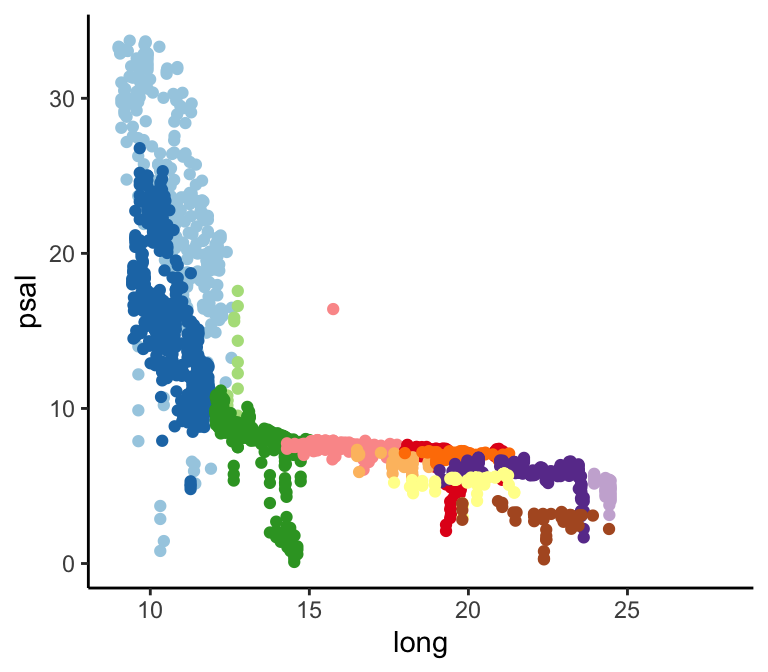
sss_sum <-summer |>
# Bildung des Temperaturmittelwerts über die 5m
group_by(ices_sd, station, lat, long, date_time, month, day) |>
summarise(psal = mean(psal, na.rm = TRUE)) |>
ungroup() |>
drop_na()
b <- ggplot(sss_sum, aes(x = long, y = psal, col = ices_sd)) +
geom_point() +
scale_colour_brewer(palette = "Paired") +
guides(colour = "none") +
theme_classic()
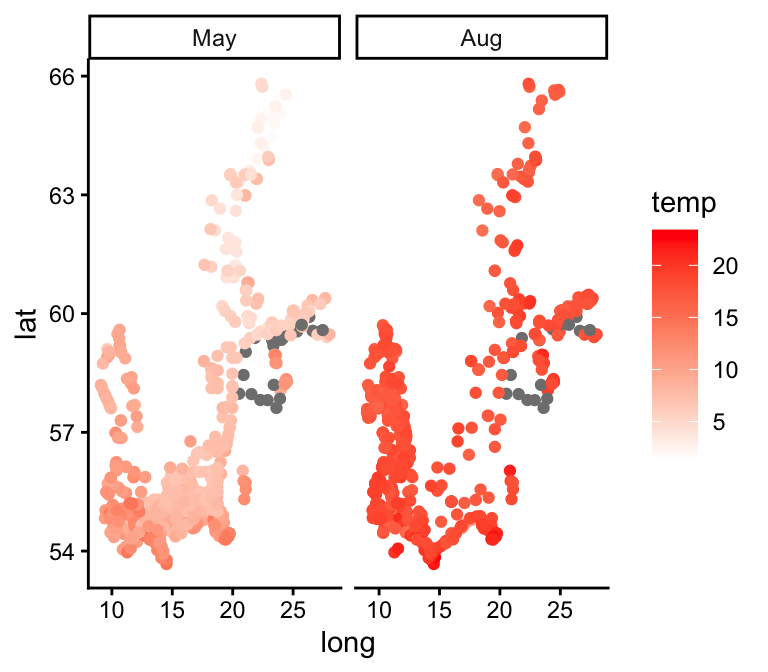
c <- sst_sum |>
filter(month %in% c("May", "Aug")) |>
ggplot(aes(long,lat))+
geom_point(aes(colour = temp)) +
scale_colour_gradient(low = "white", high = "red") +
facet_grid(. ~ month) +
theme_classic() 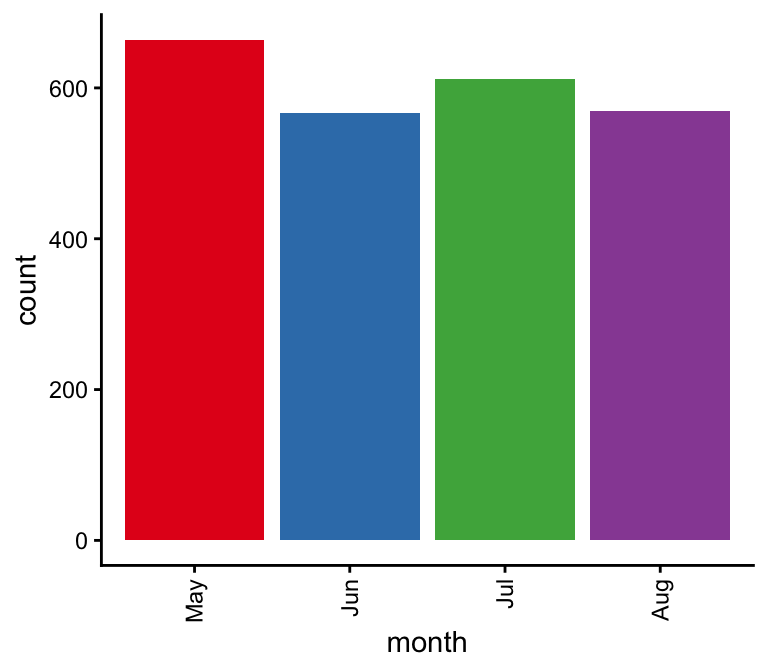


